Dashboard Preview
A glimpse of what's inside
Explore the powerful features of AInamika dashboard
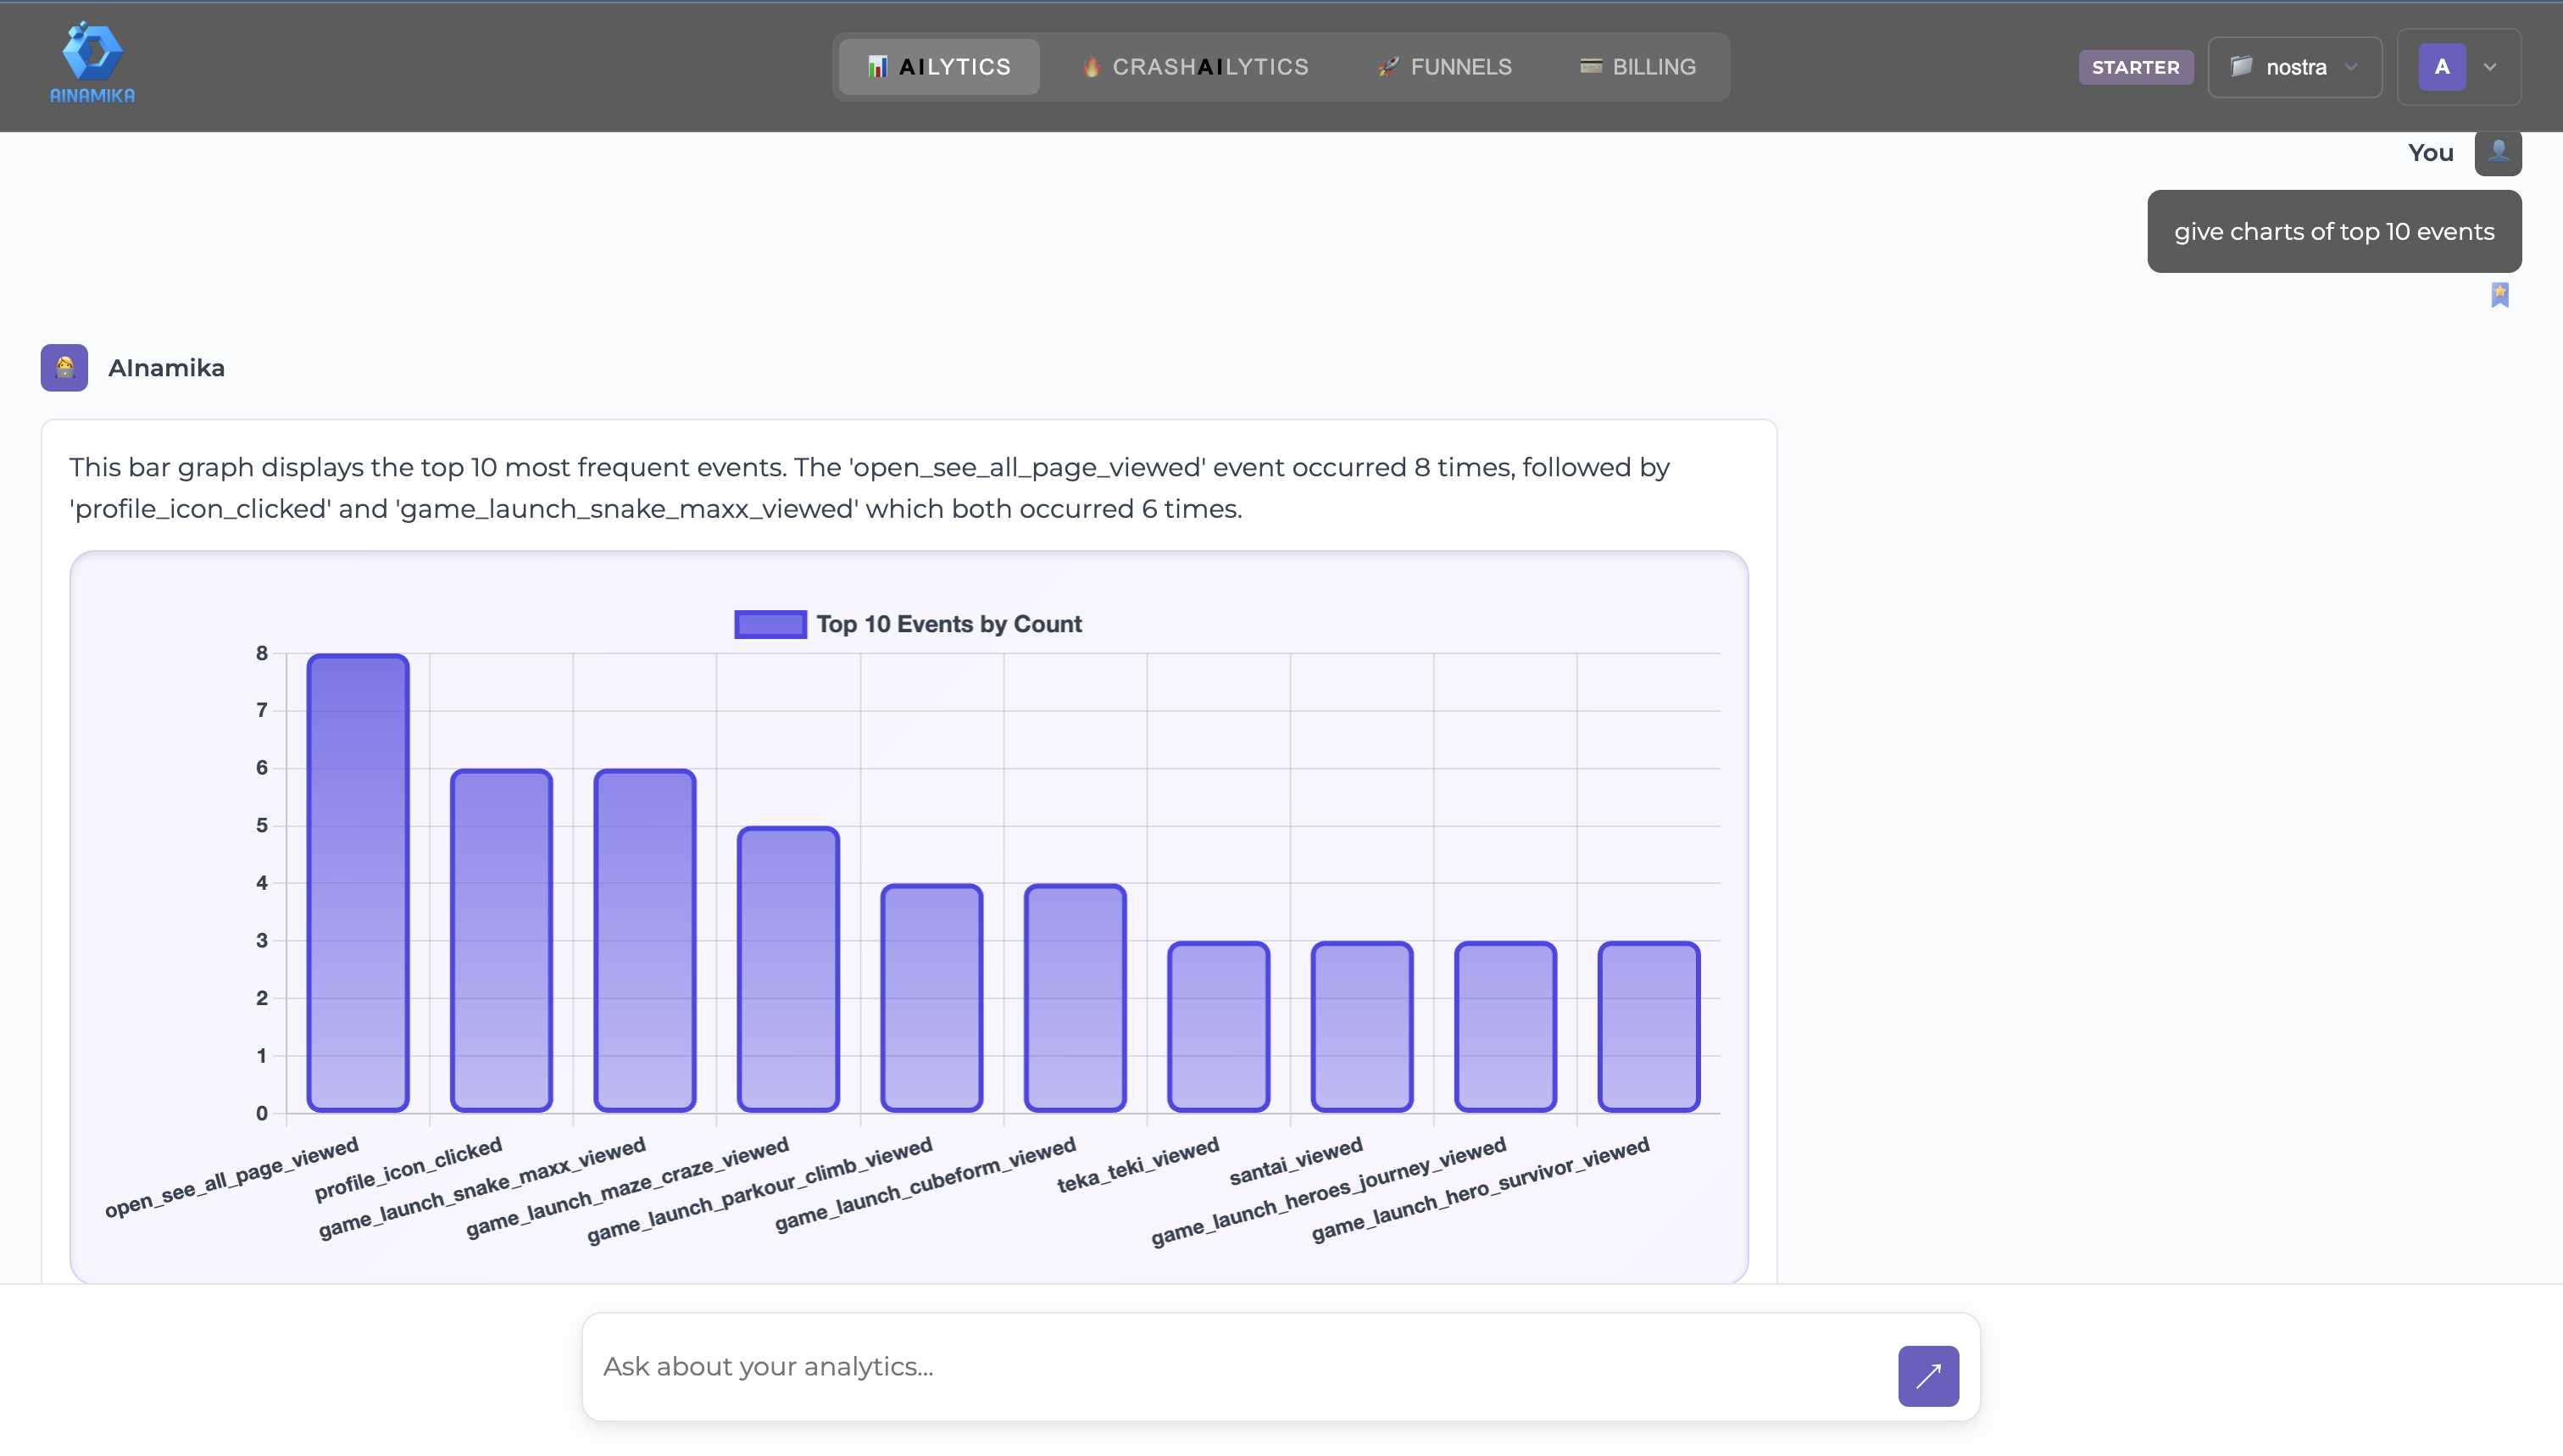
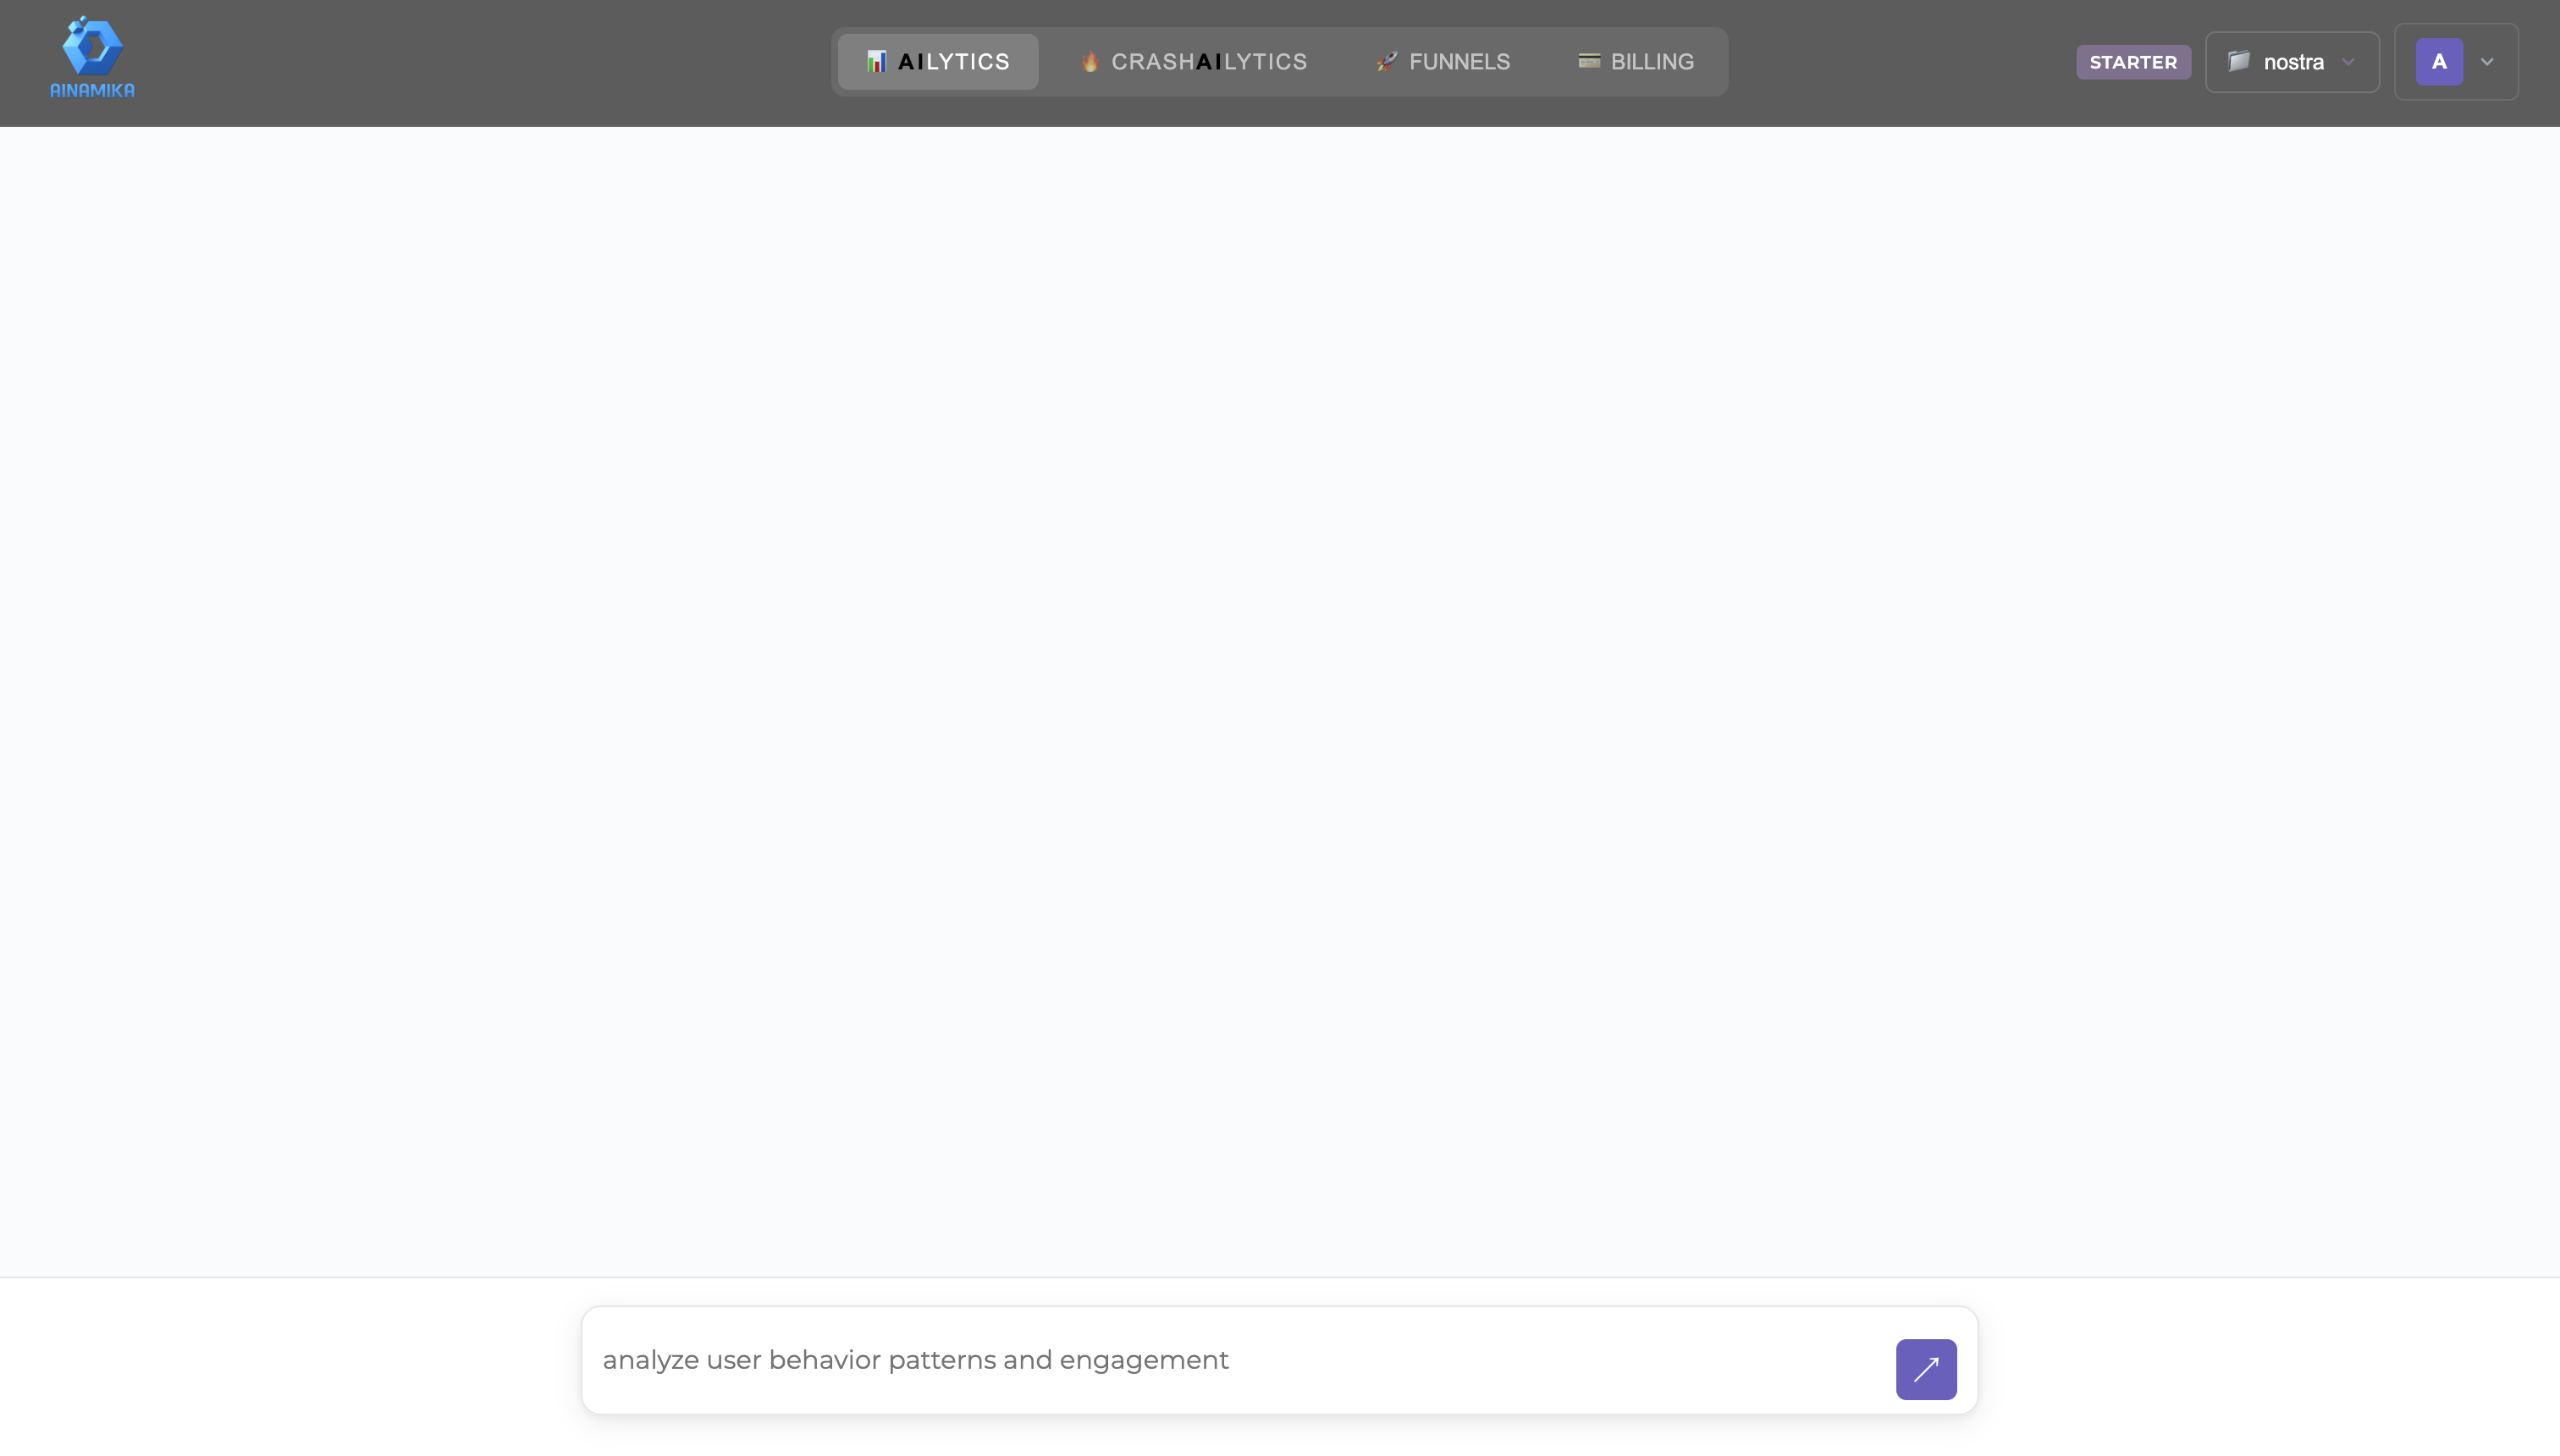
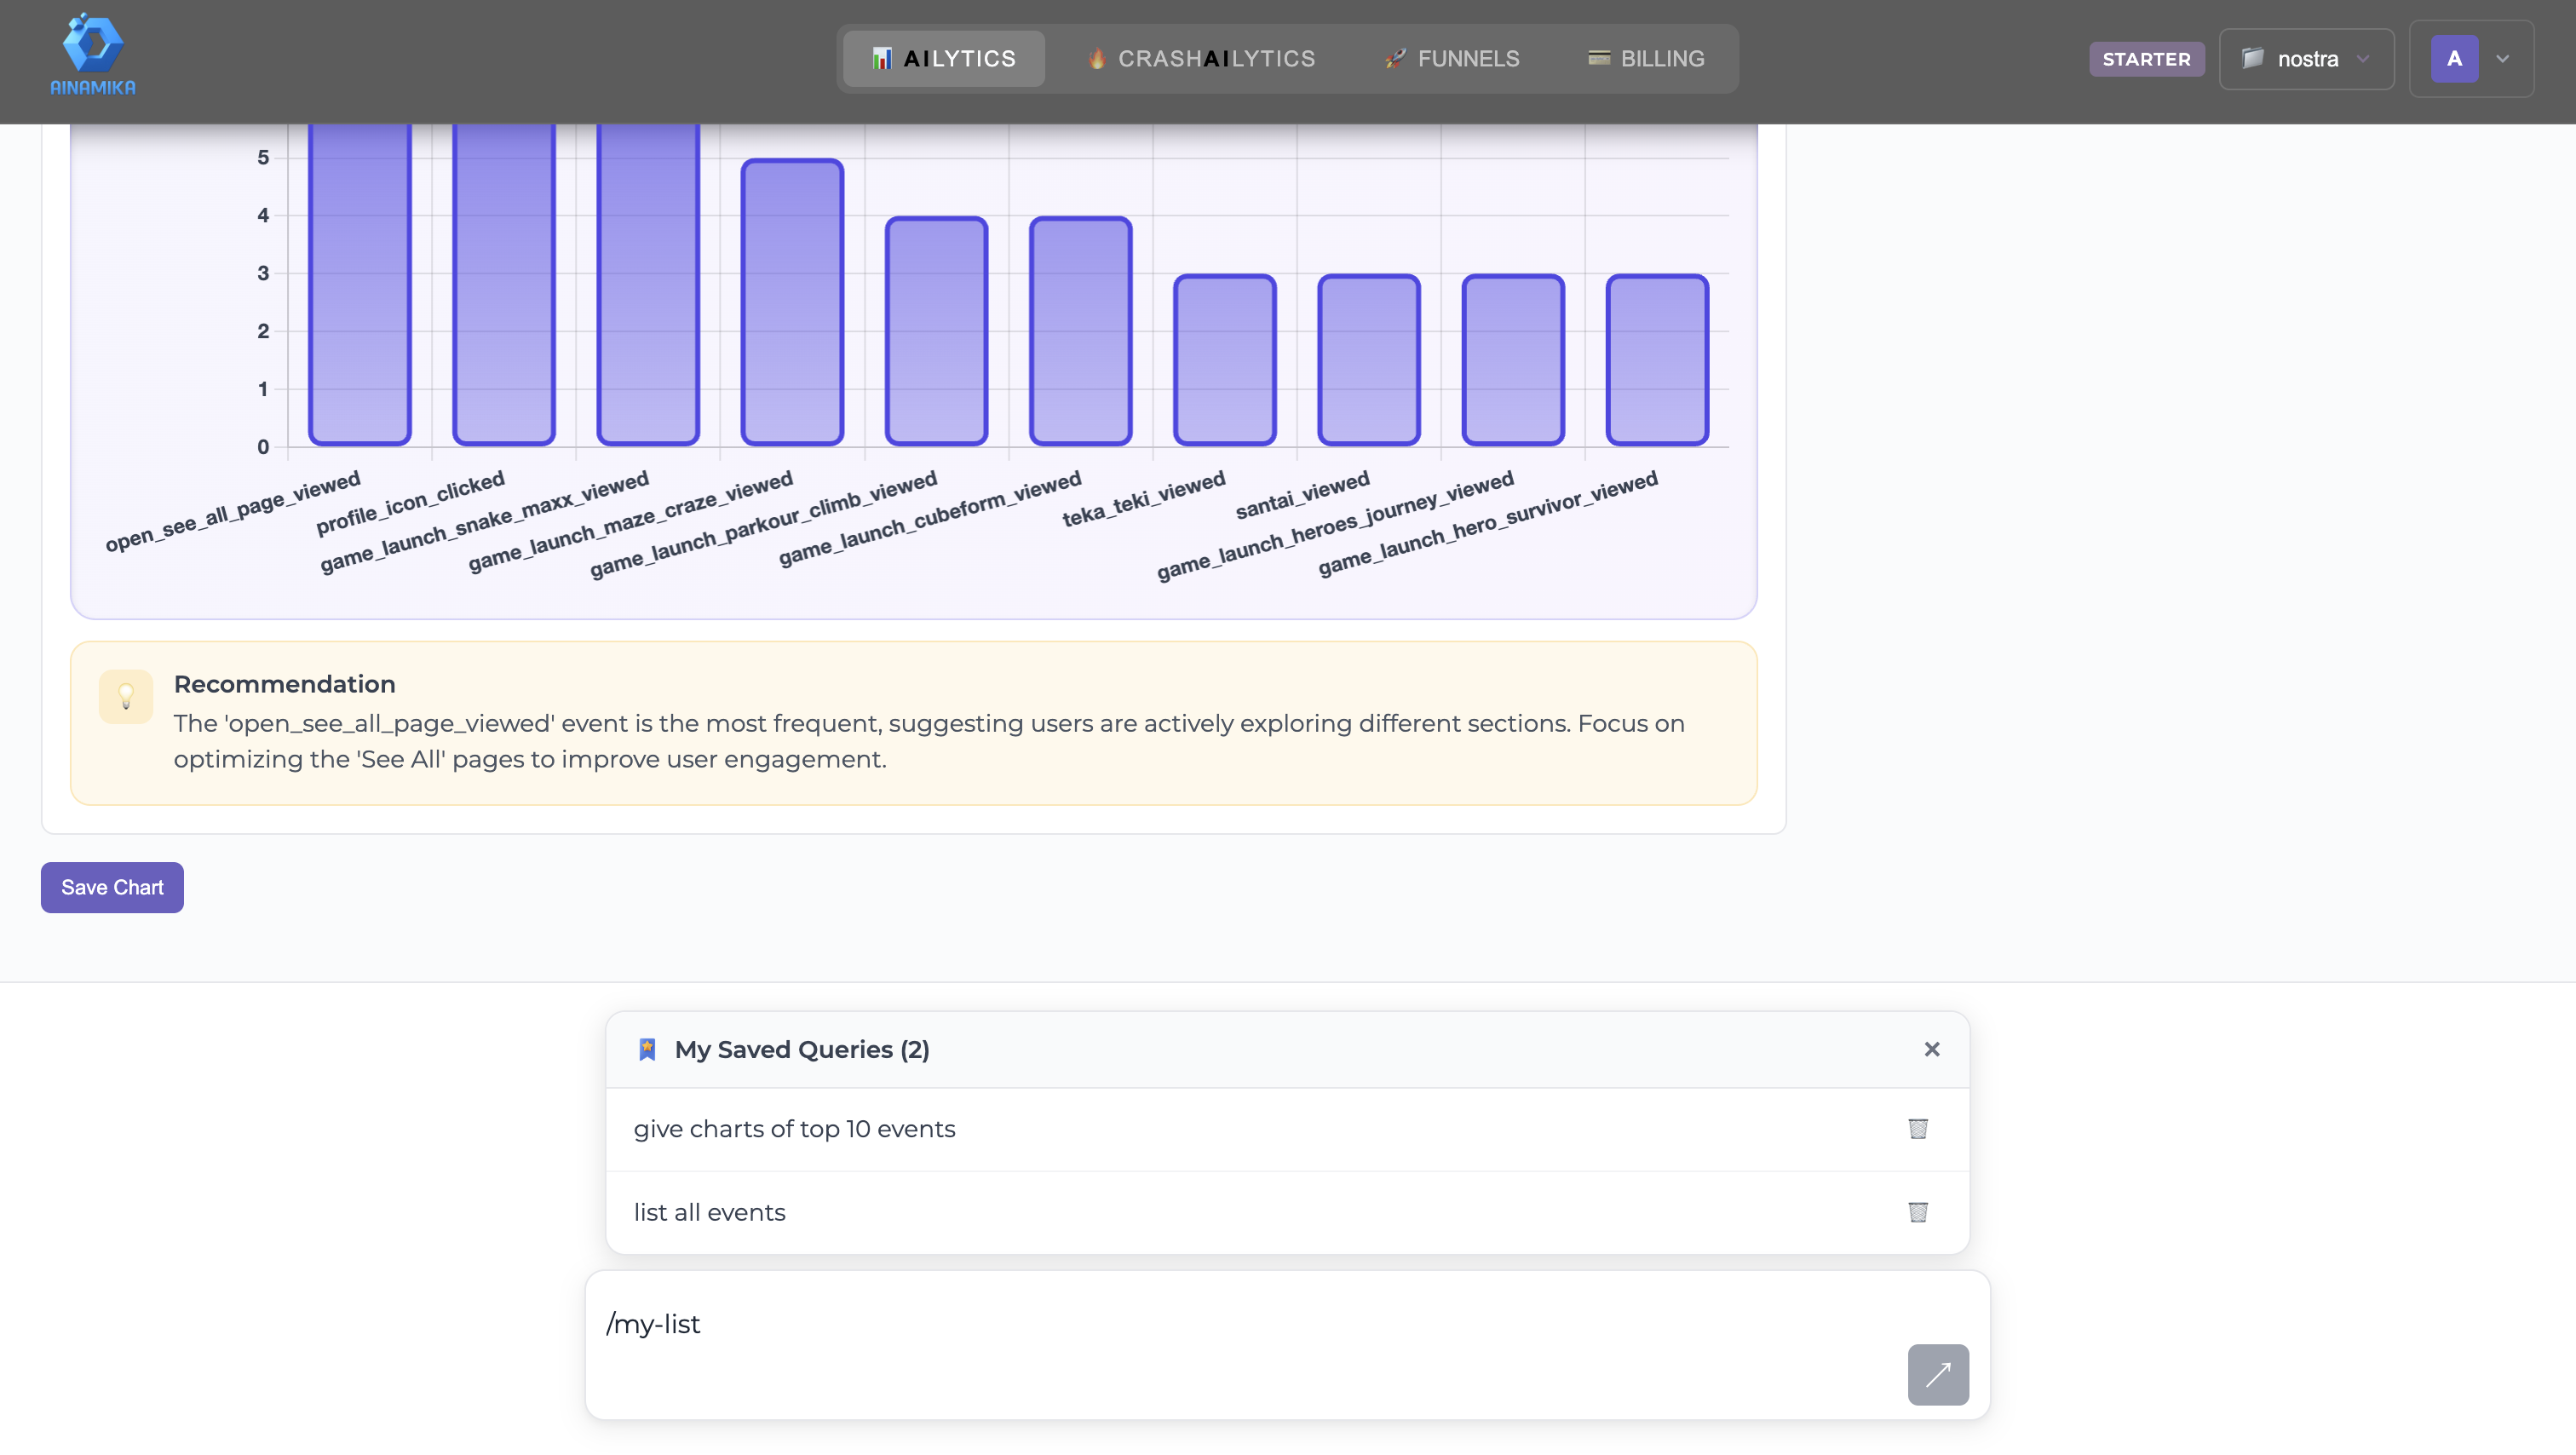
AI-Generated Charts & Insights
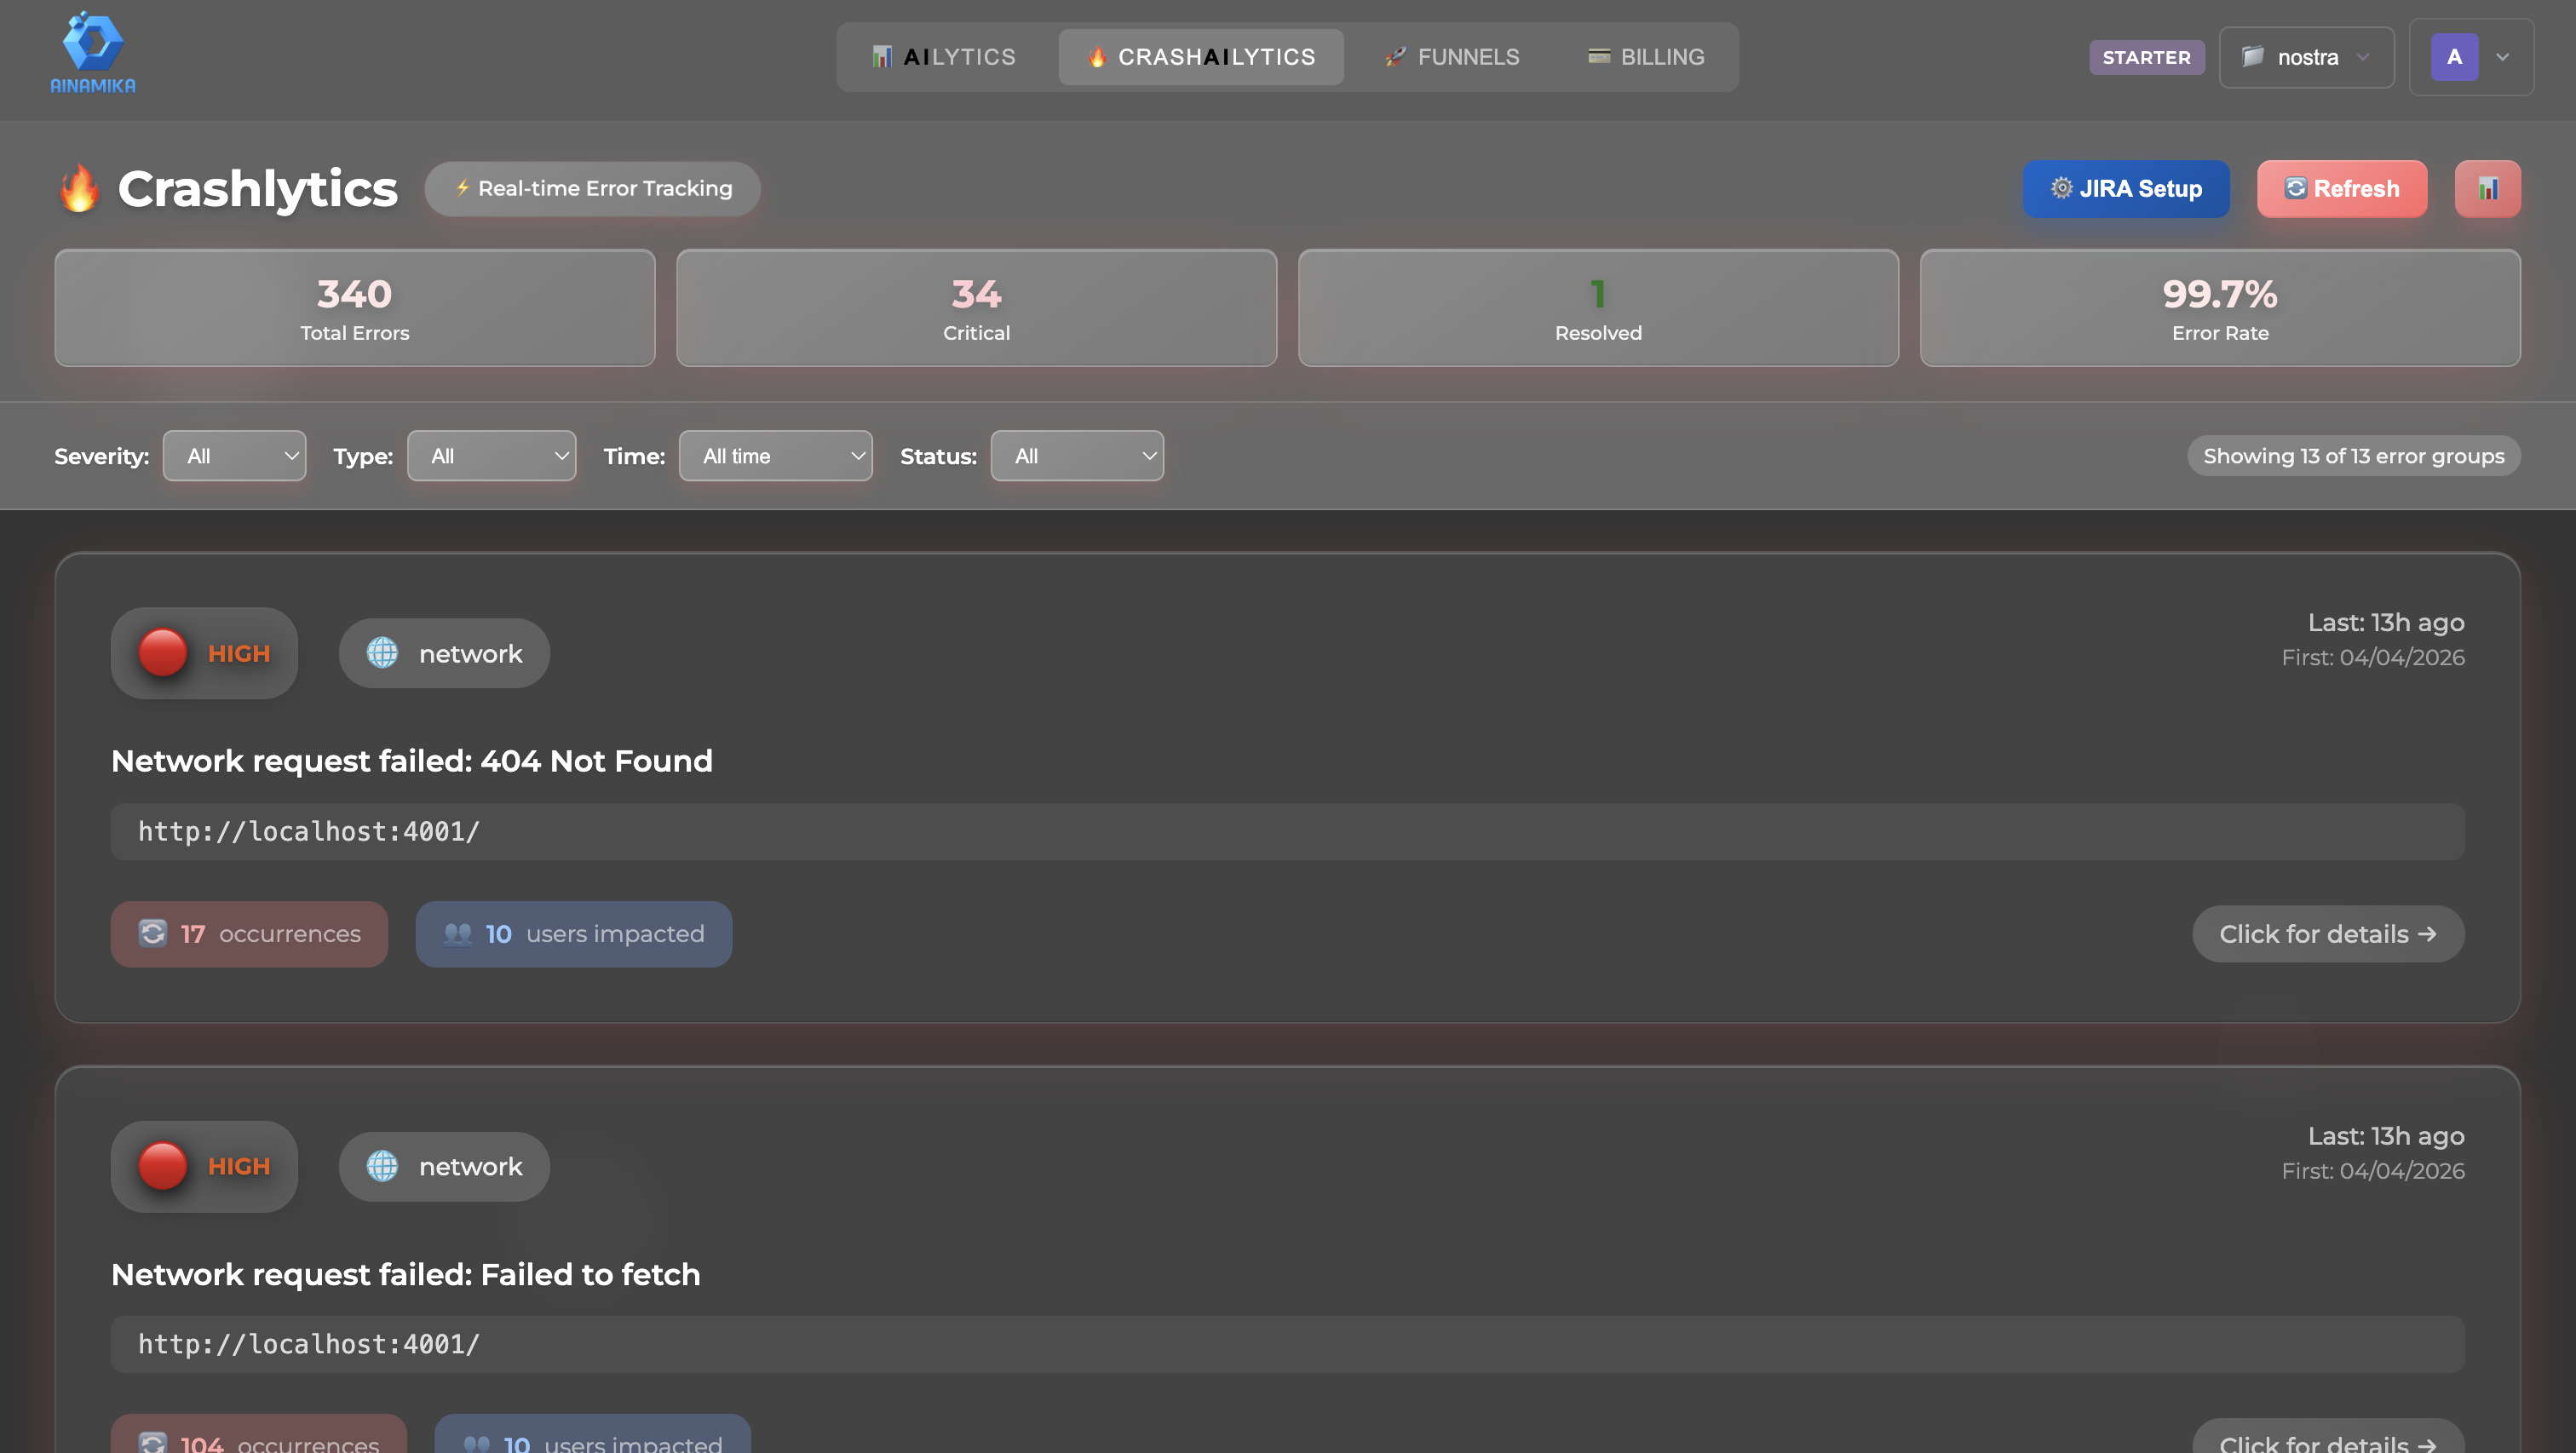
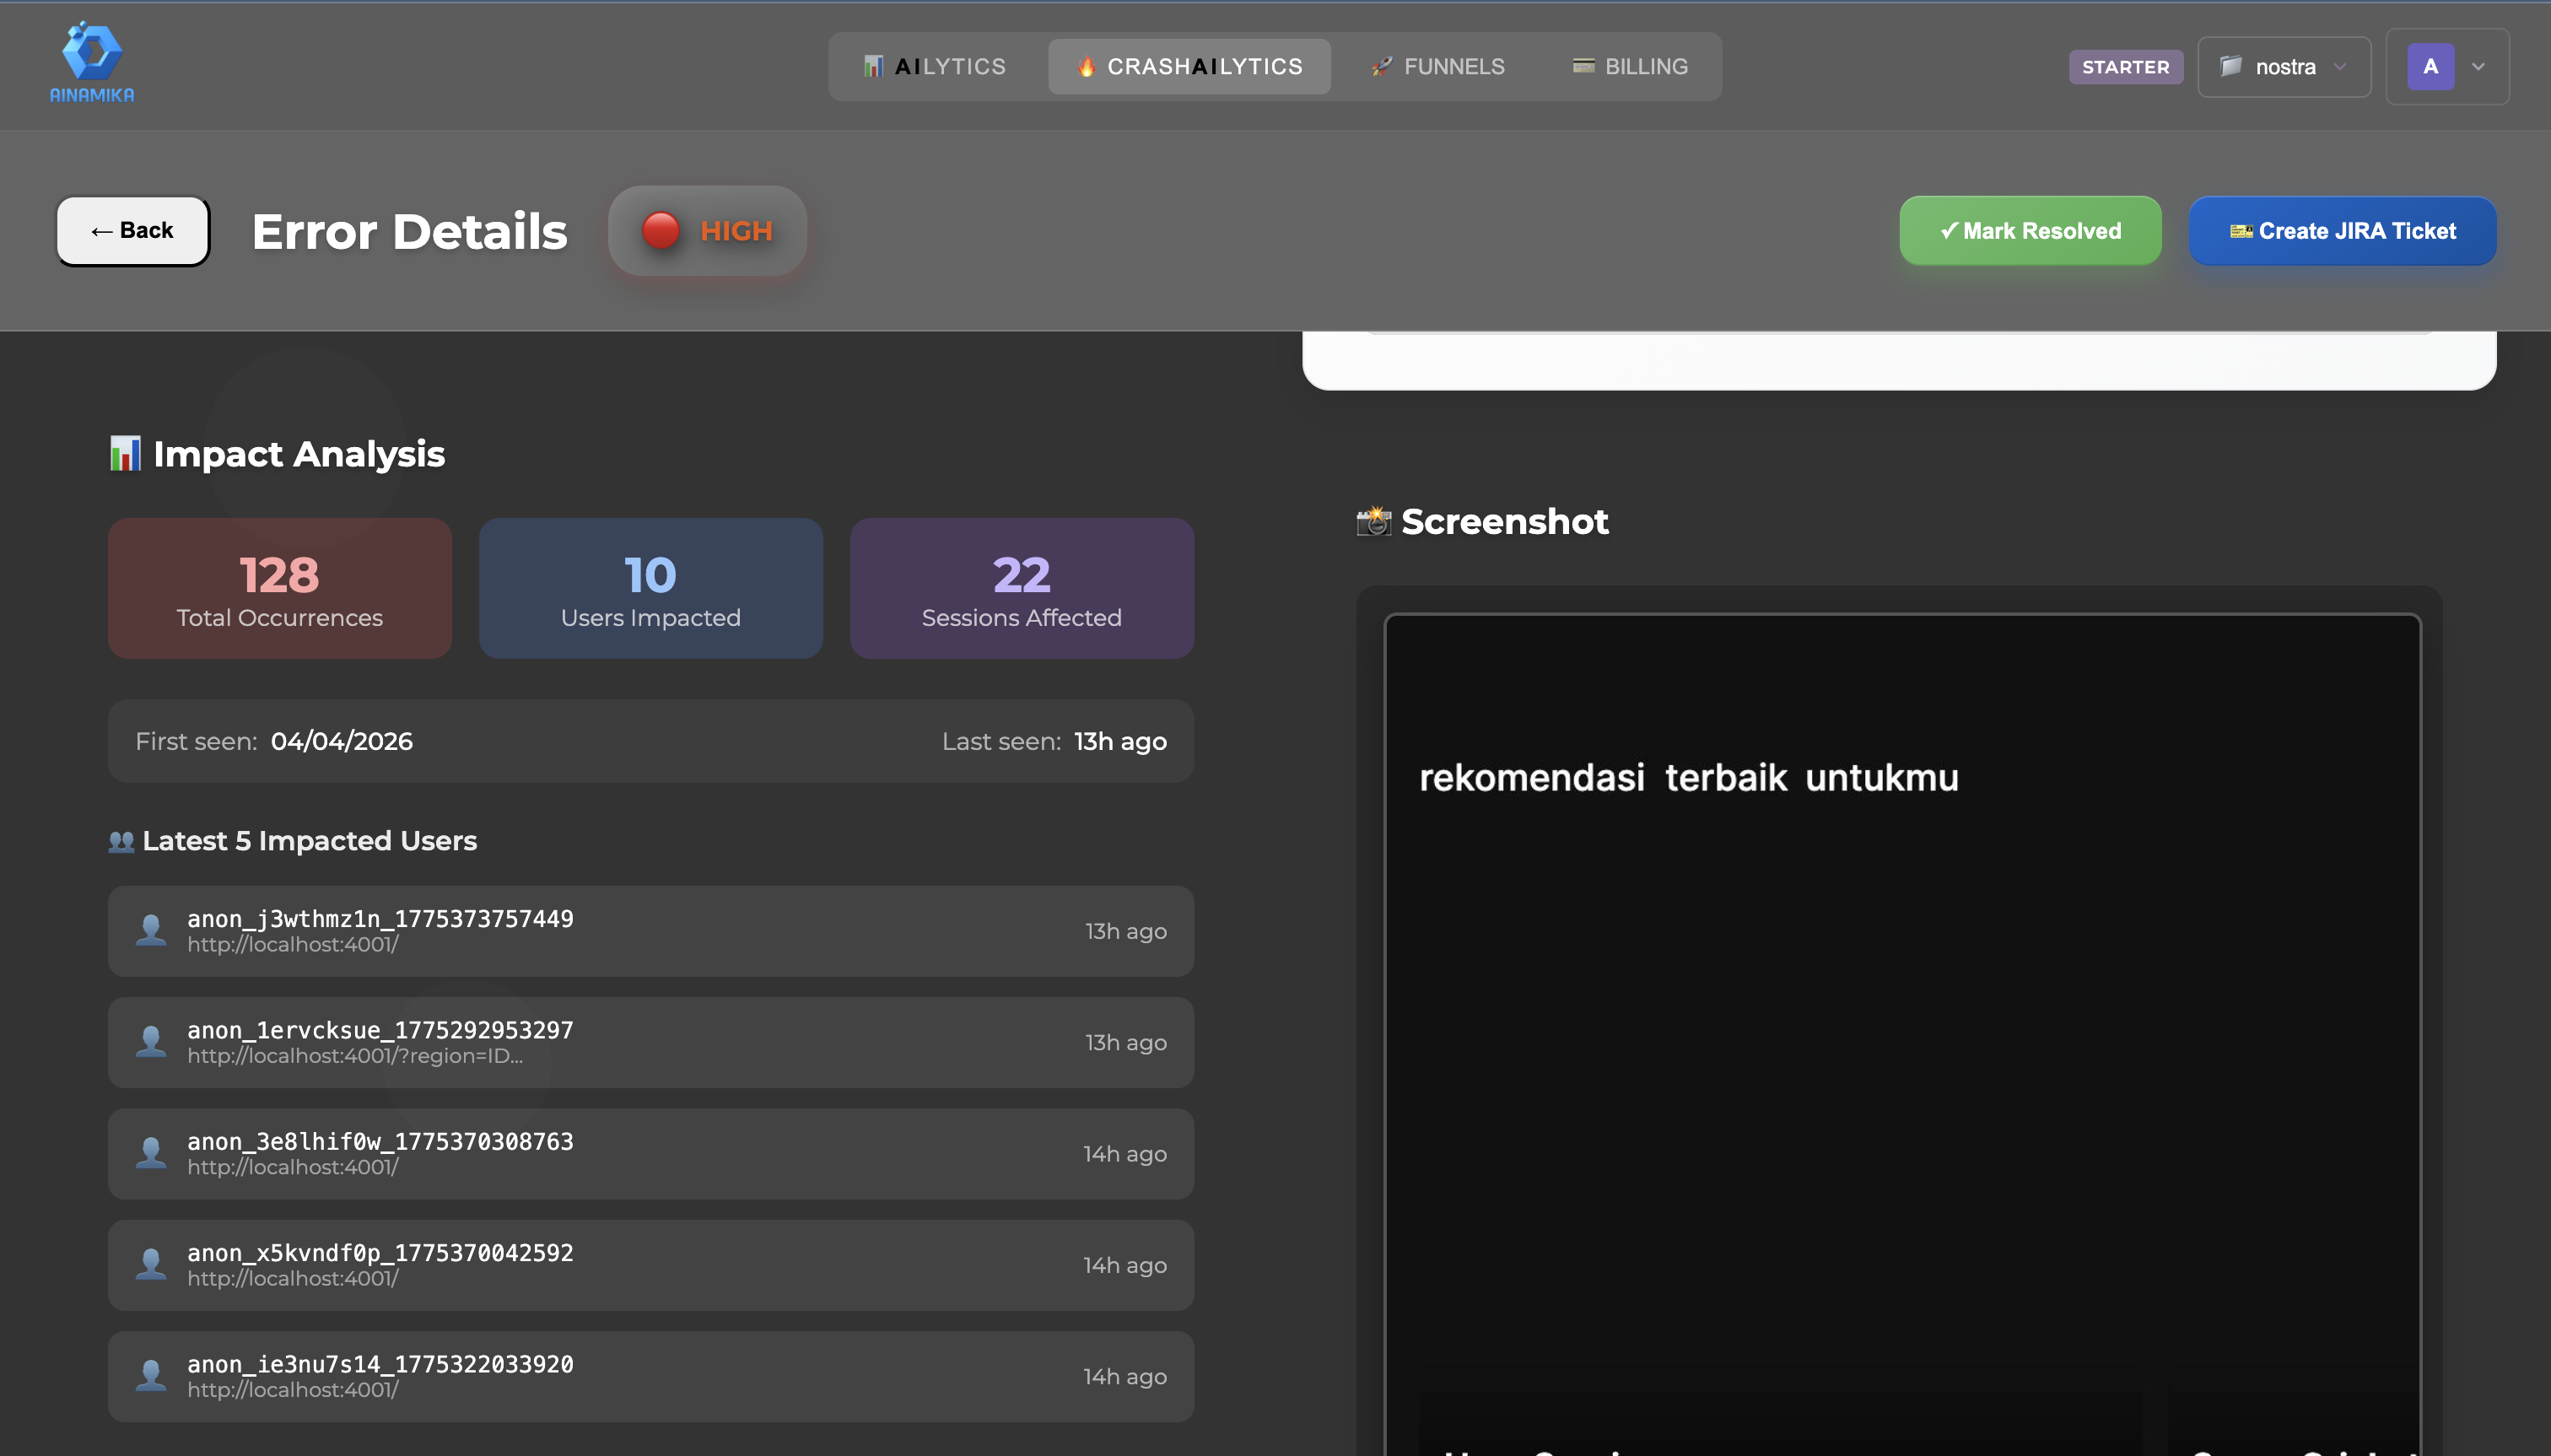
Intelligent Error Tracking
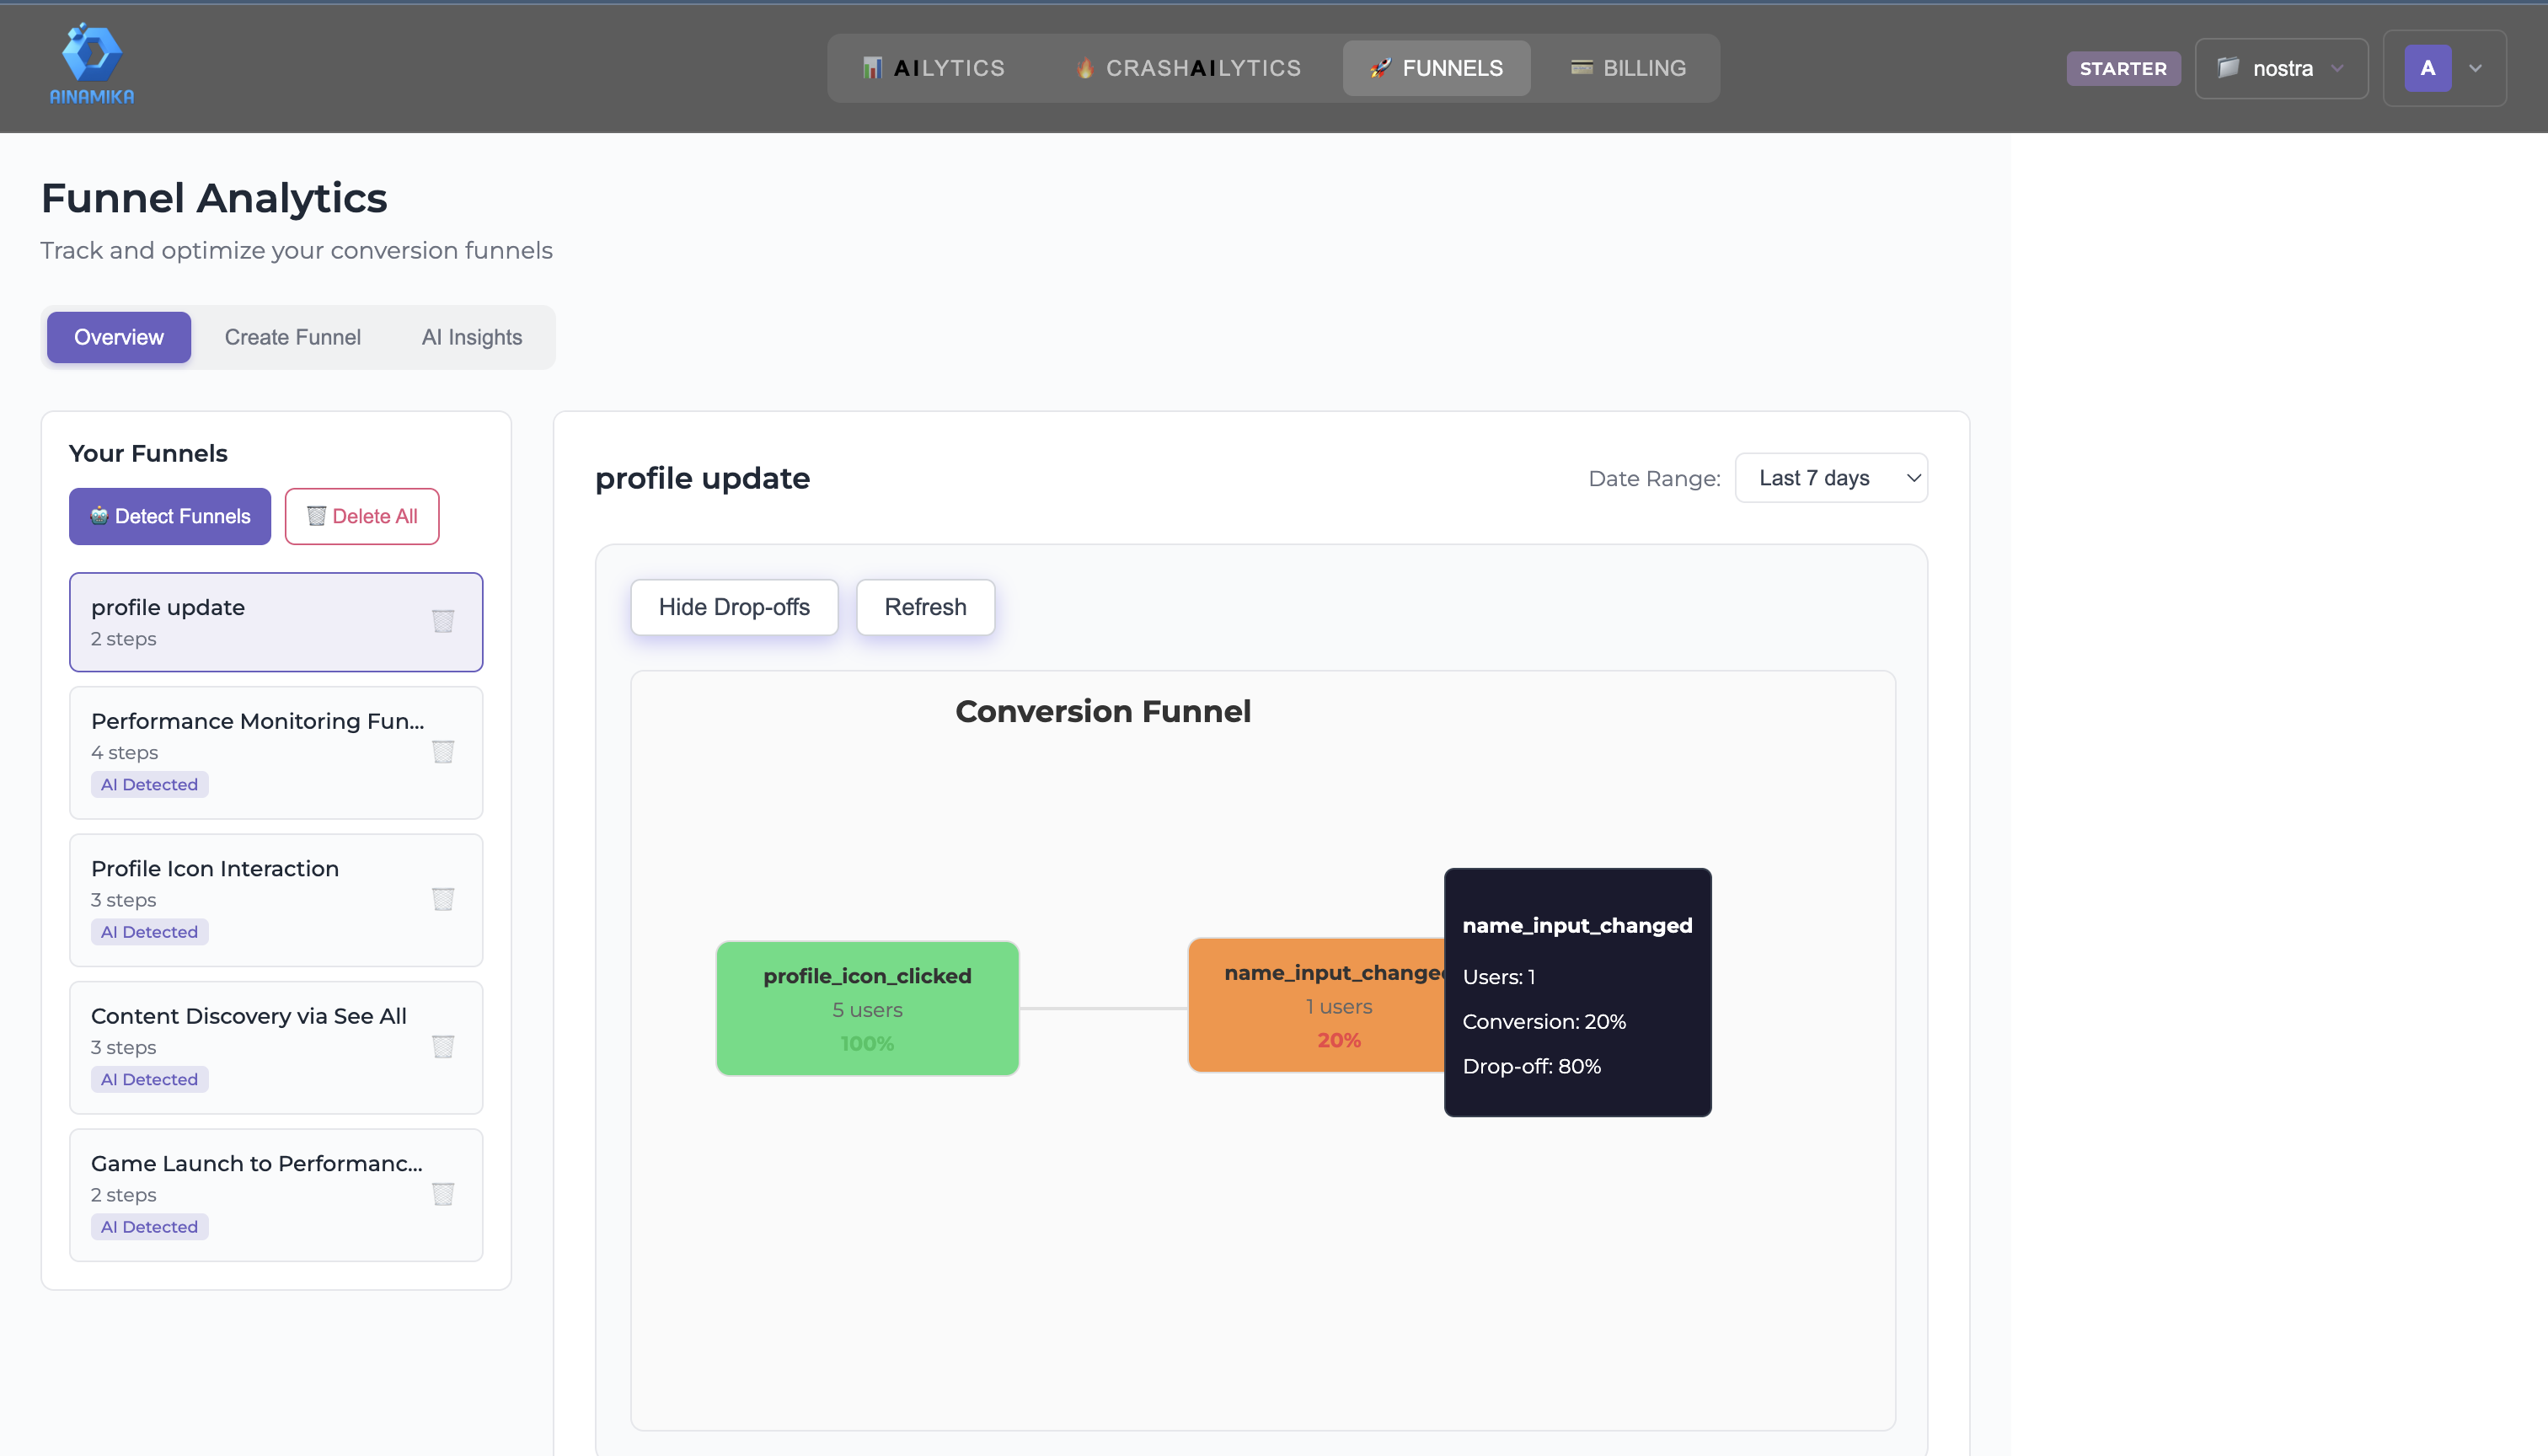
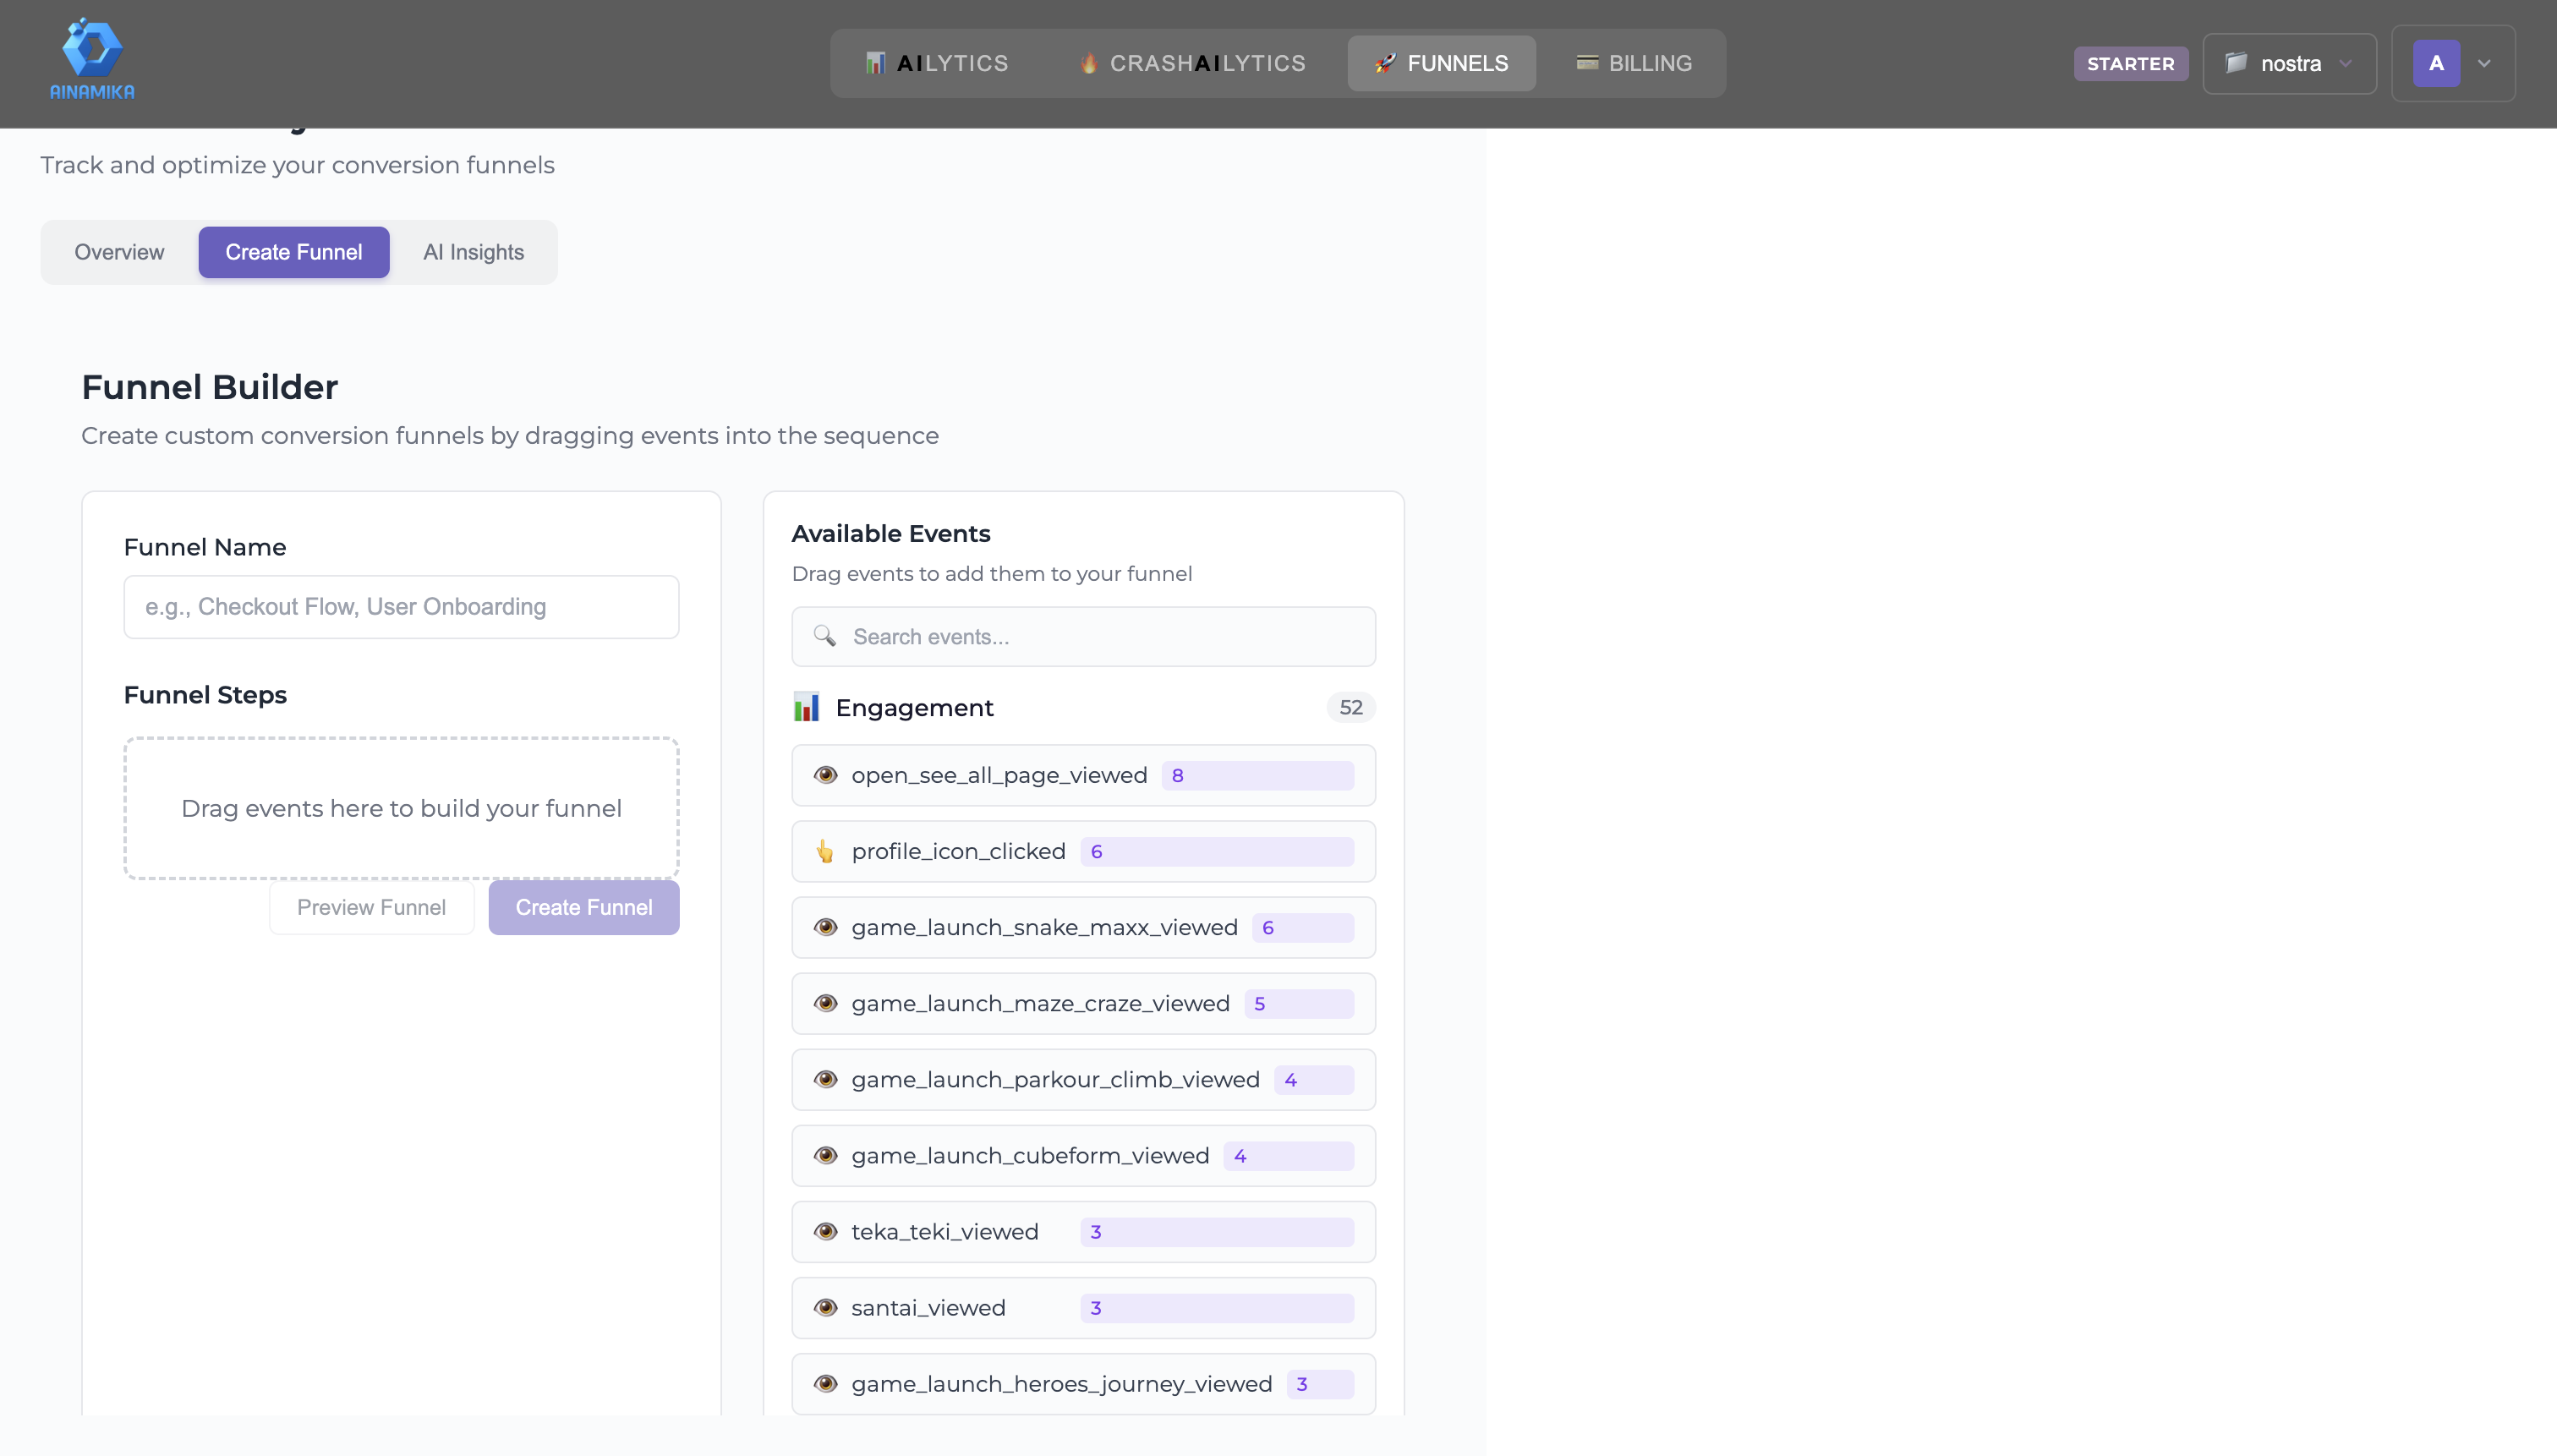
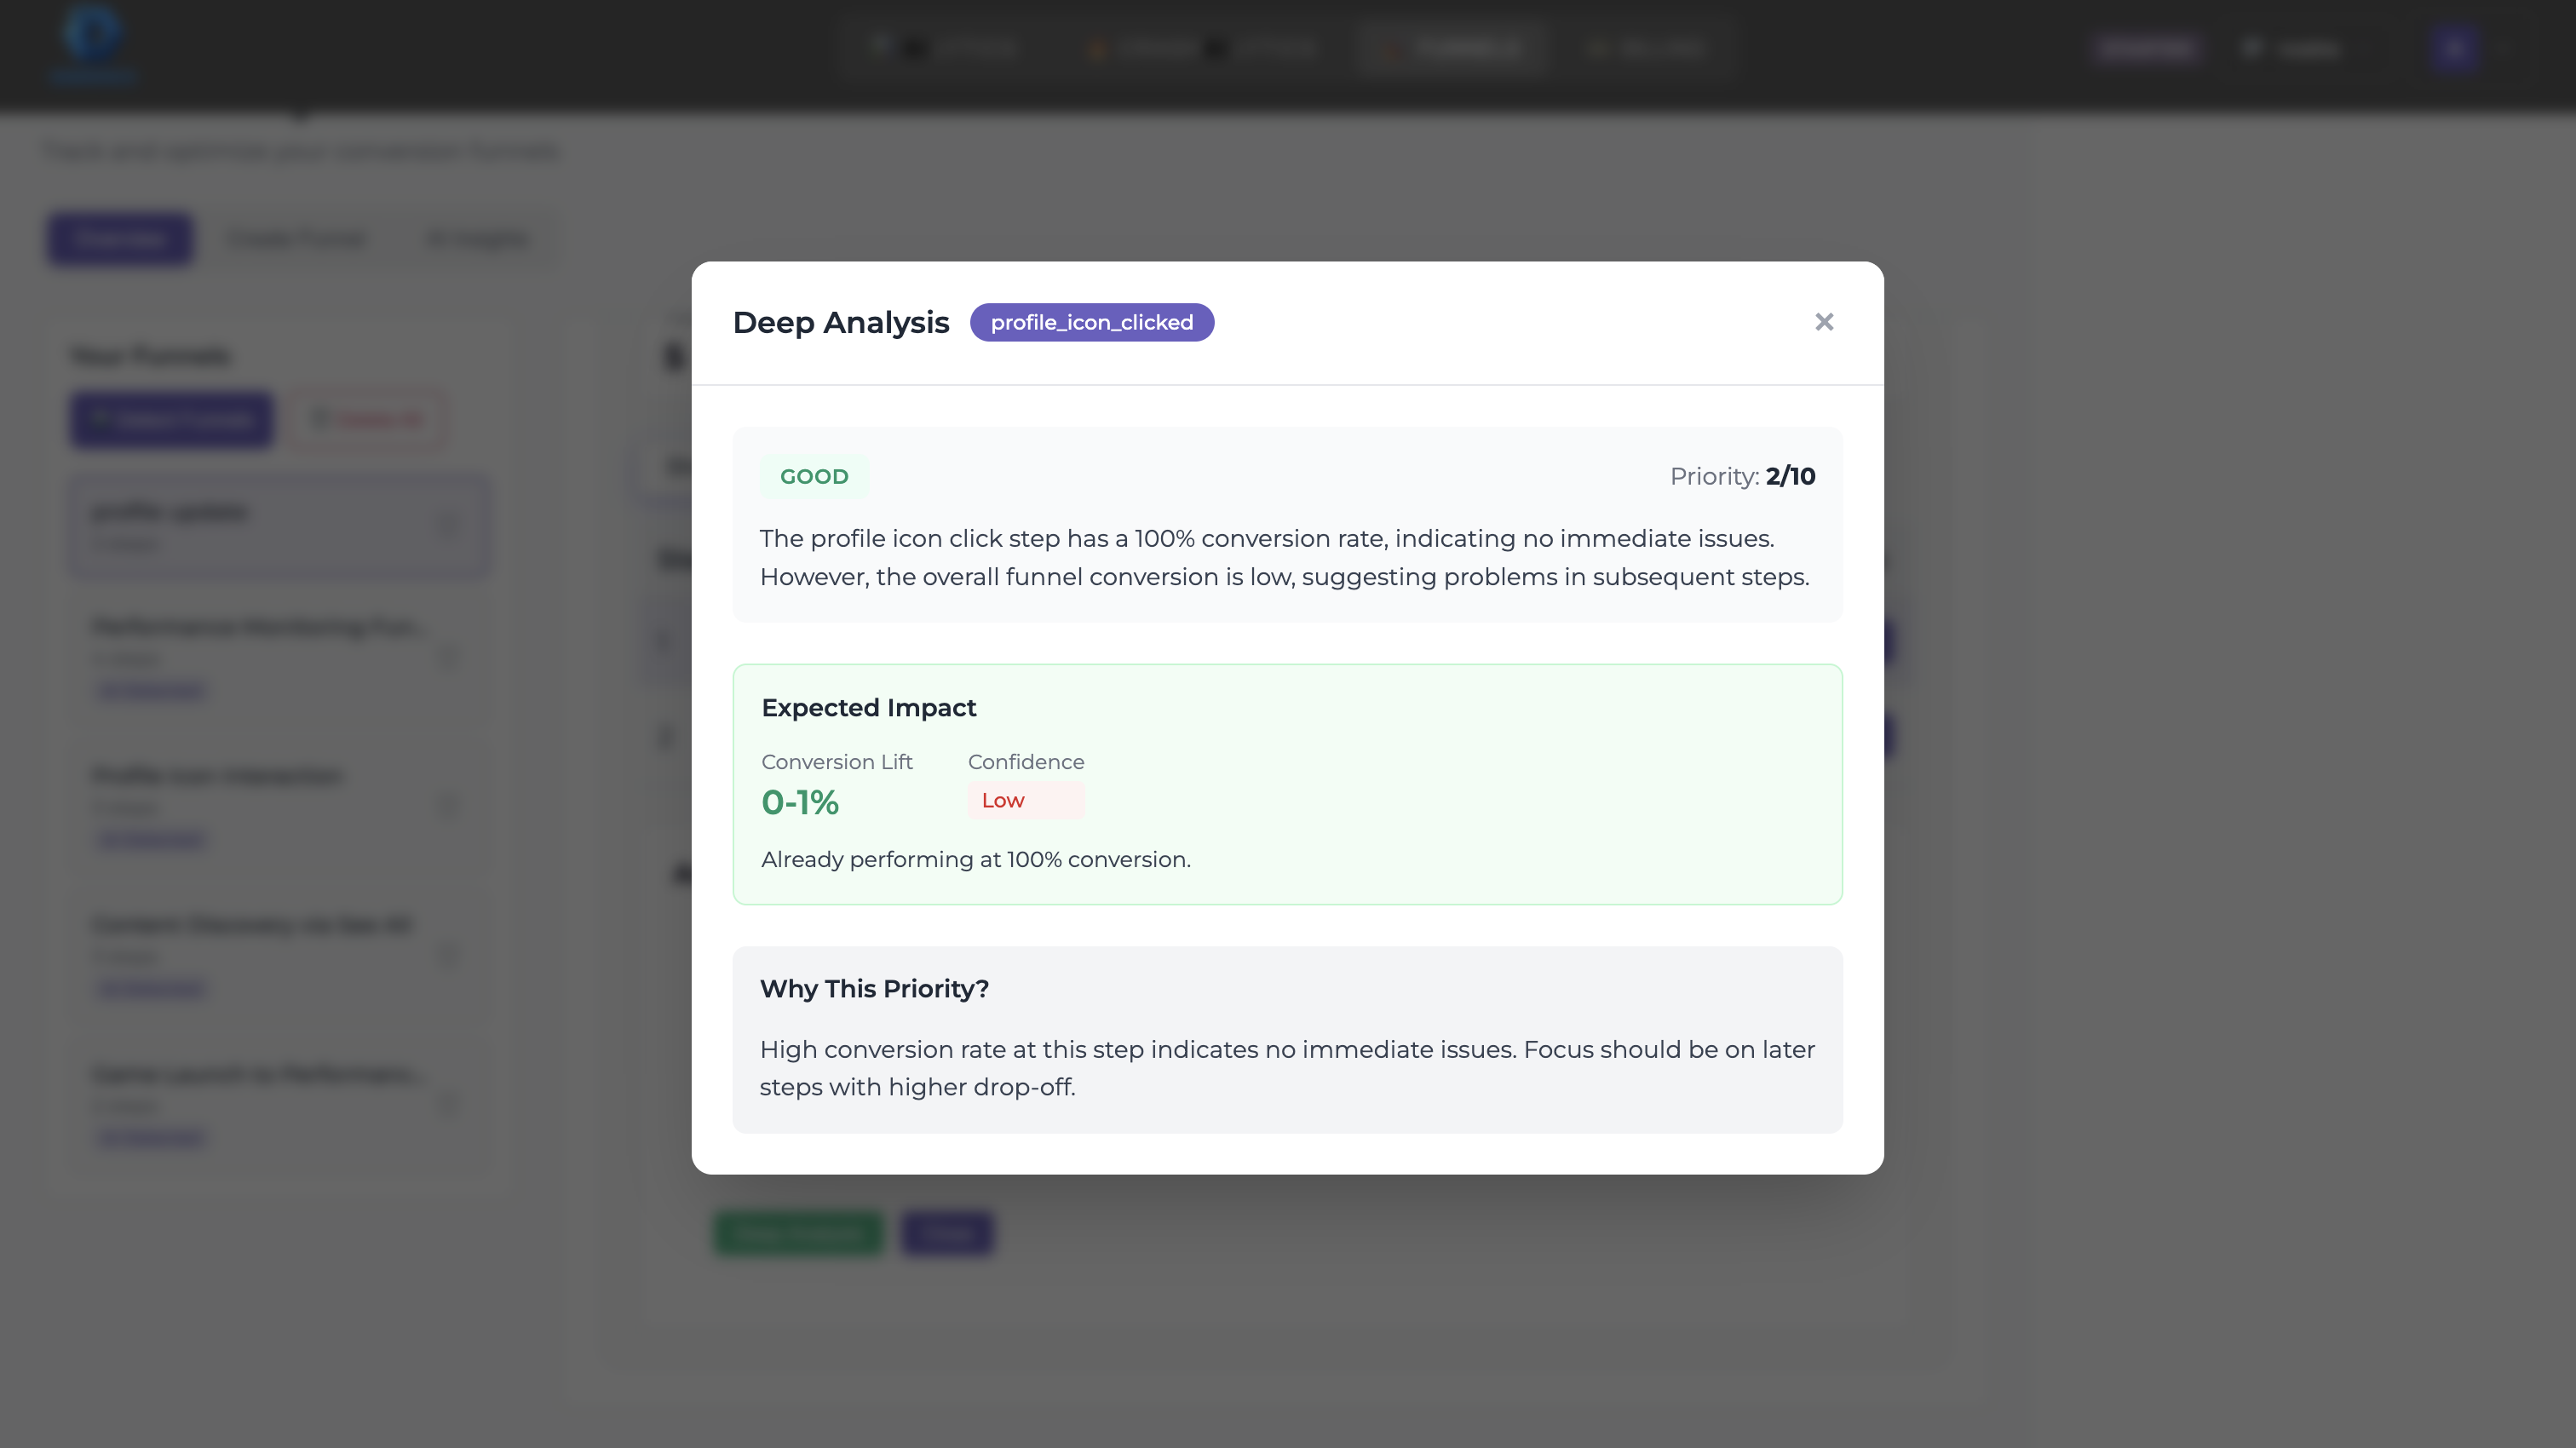
Conversion Funnel Analysis
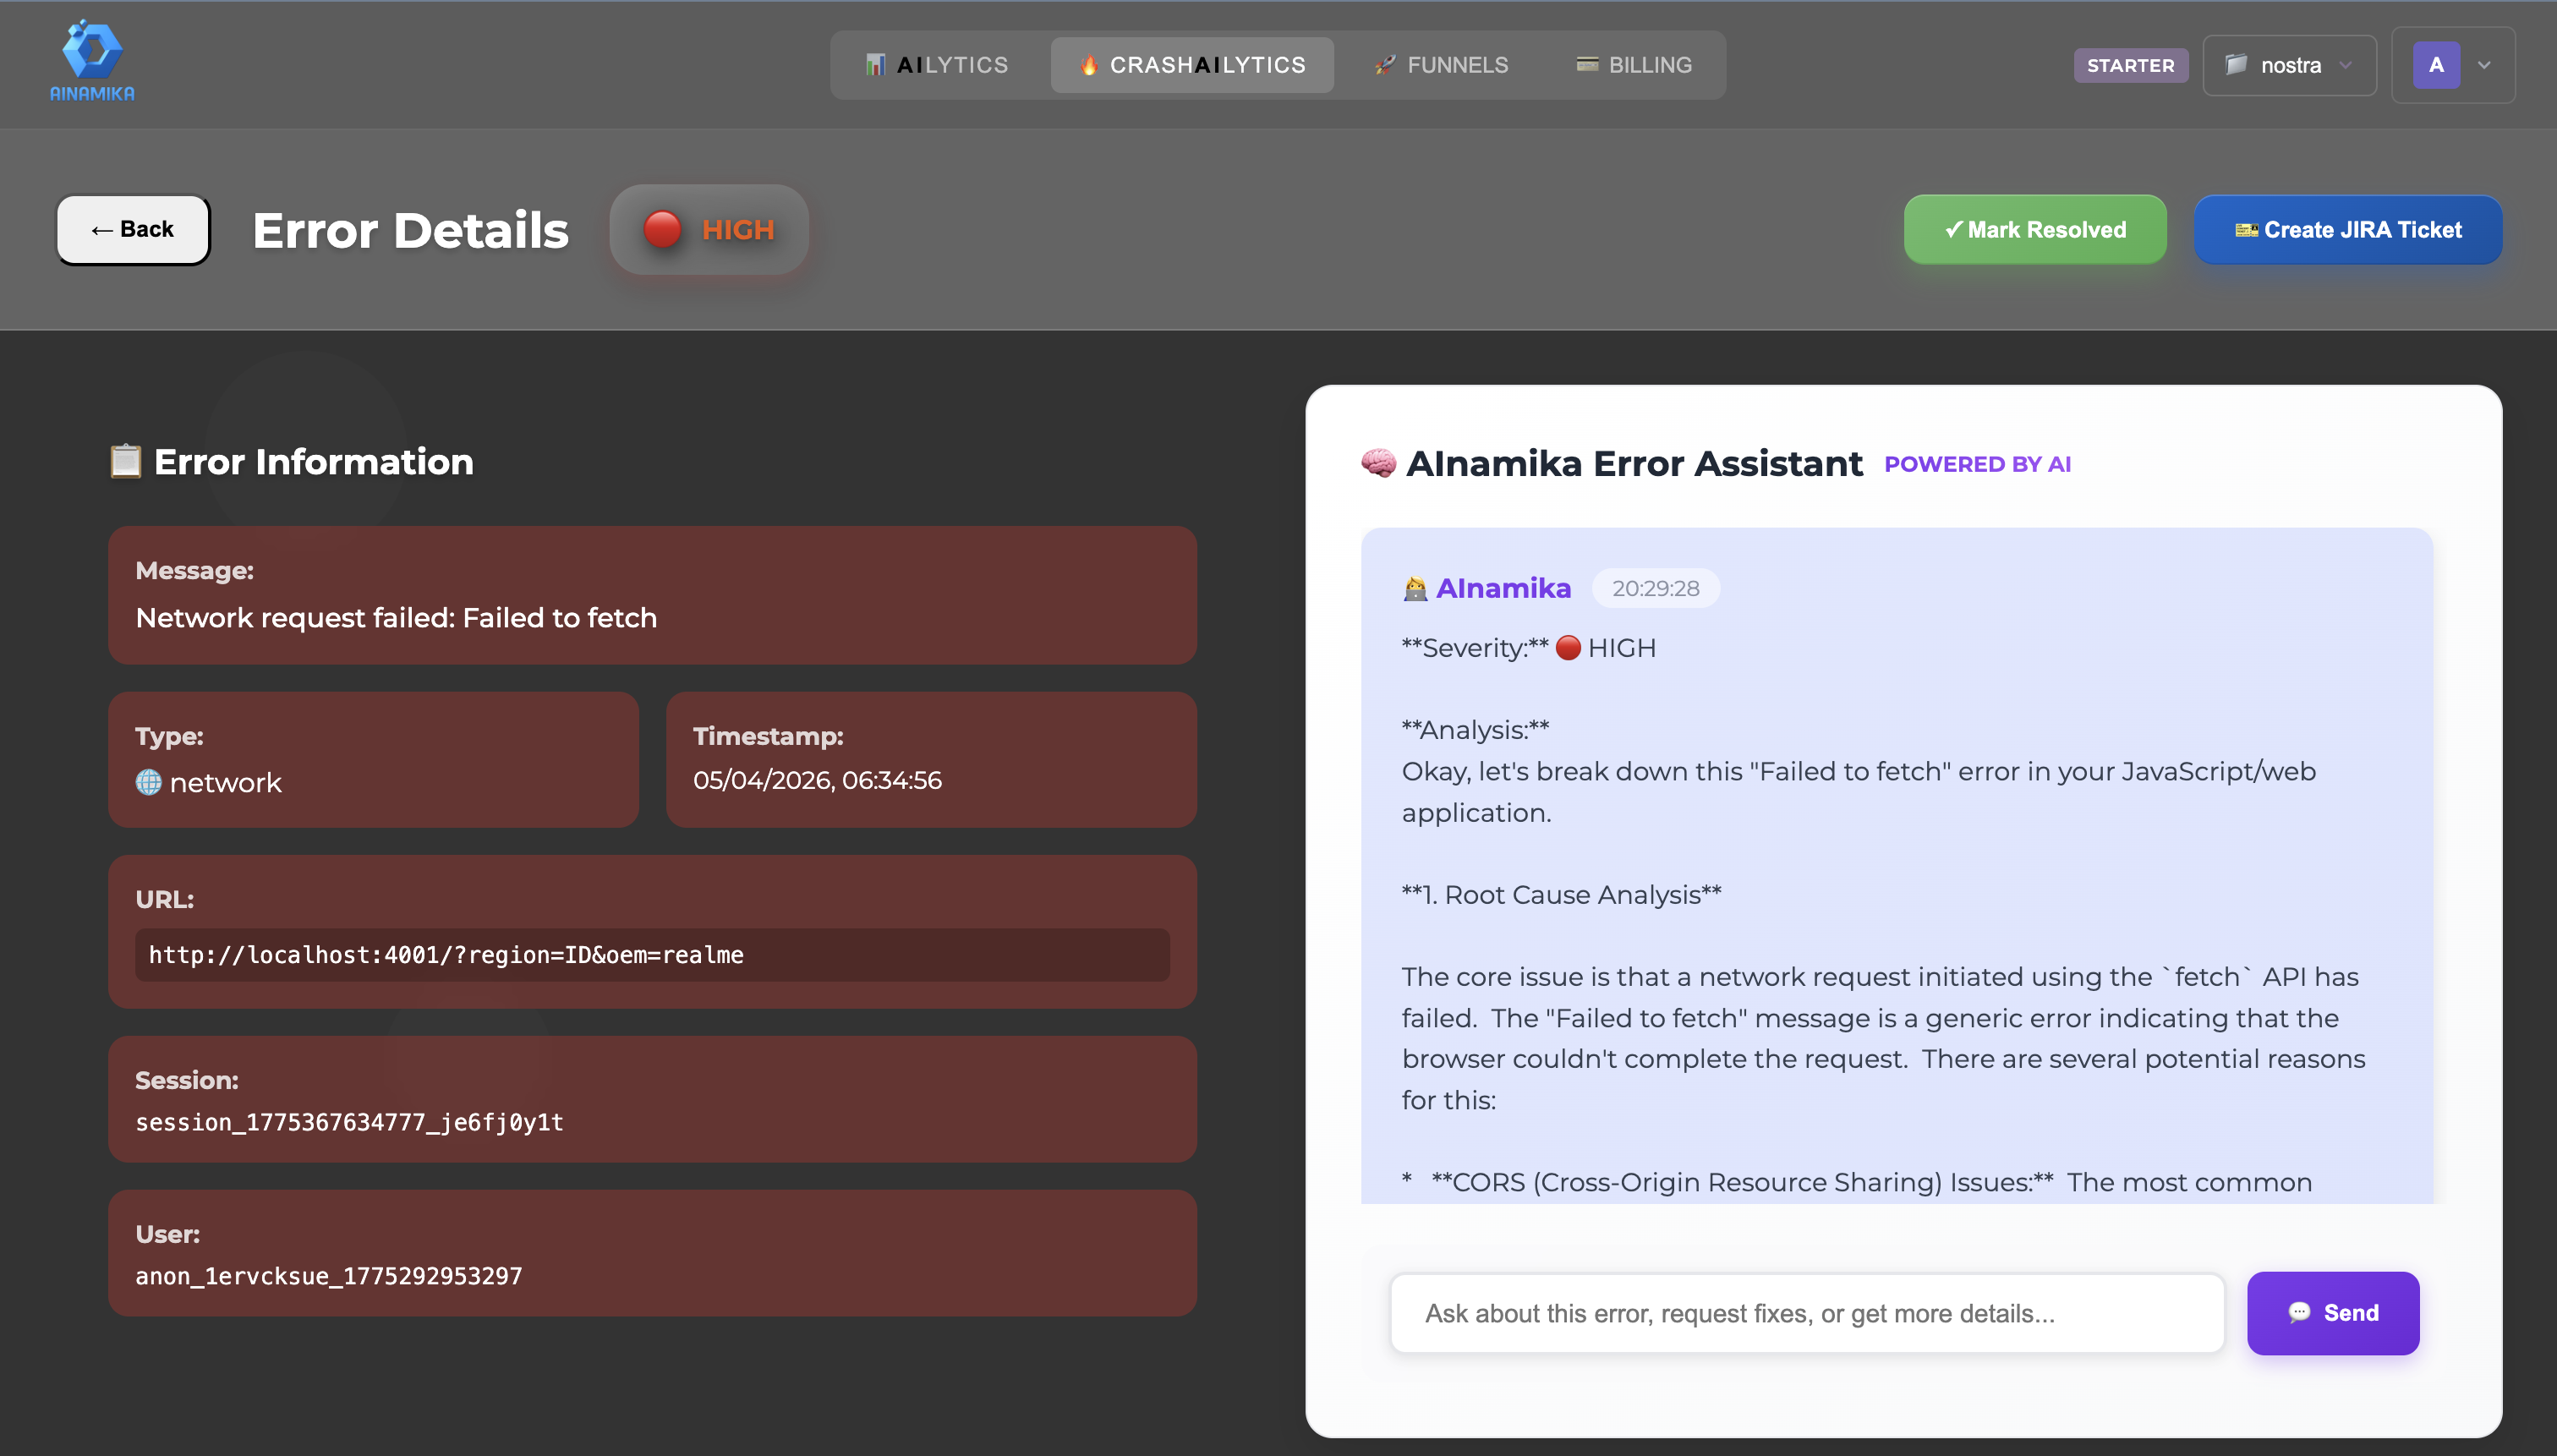
AI-Powered Error Analysis
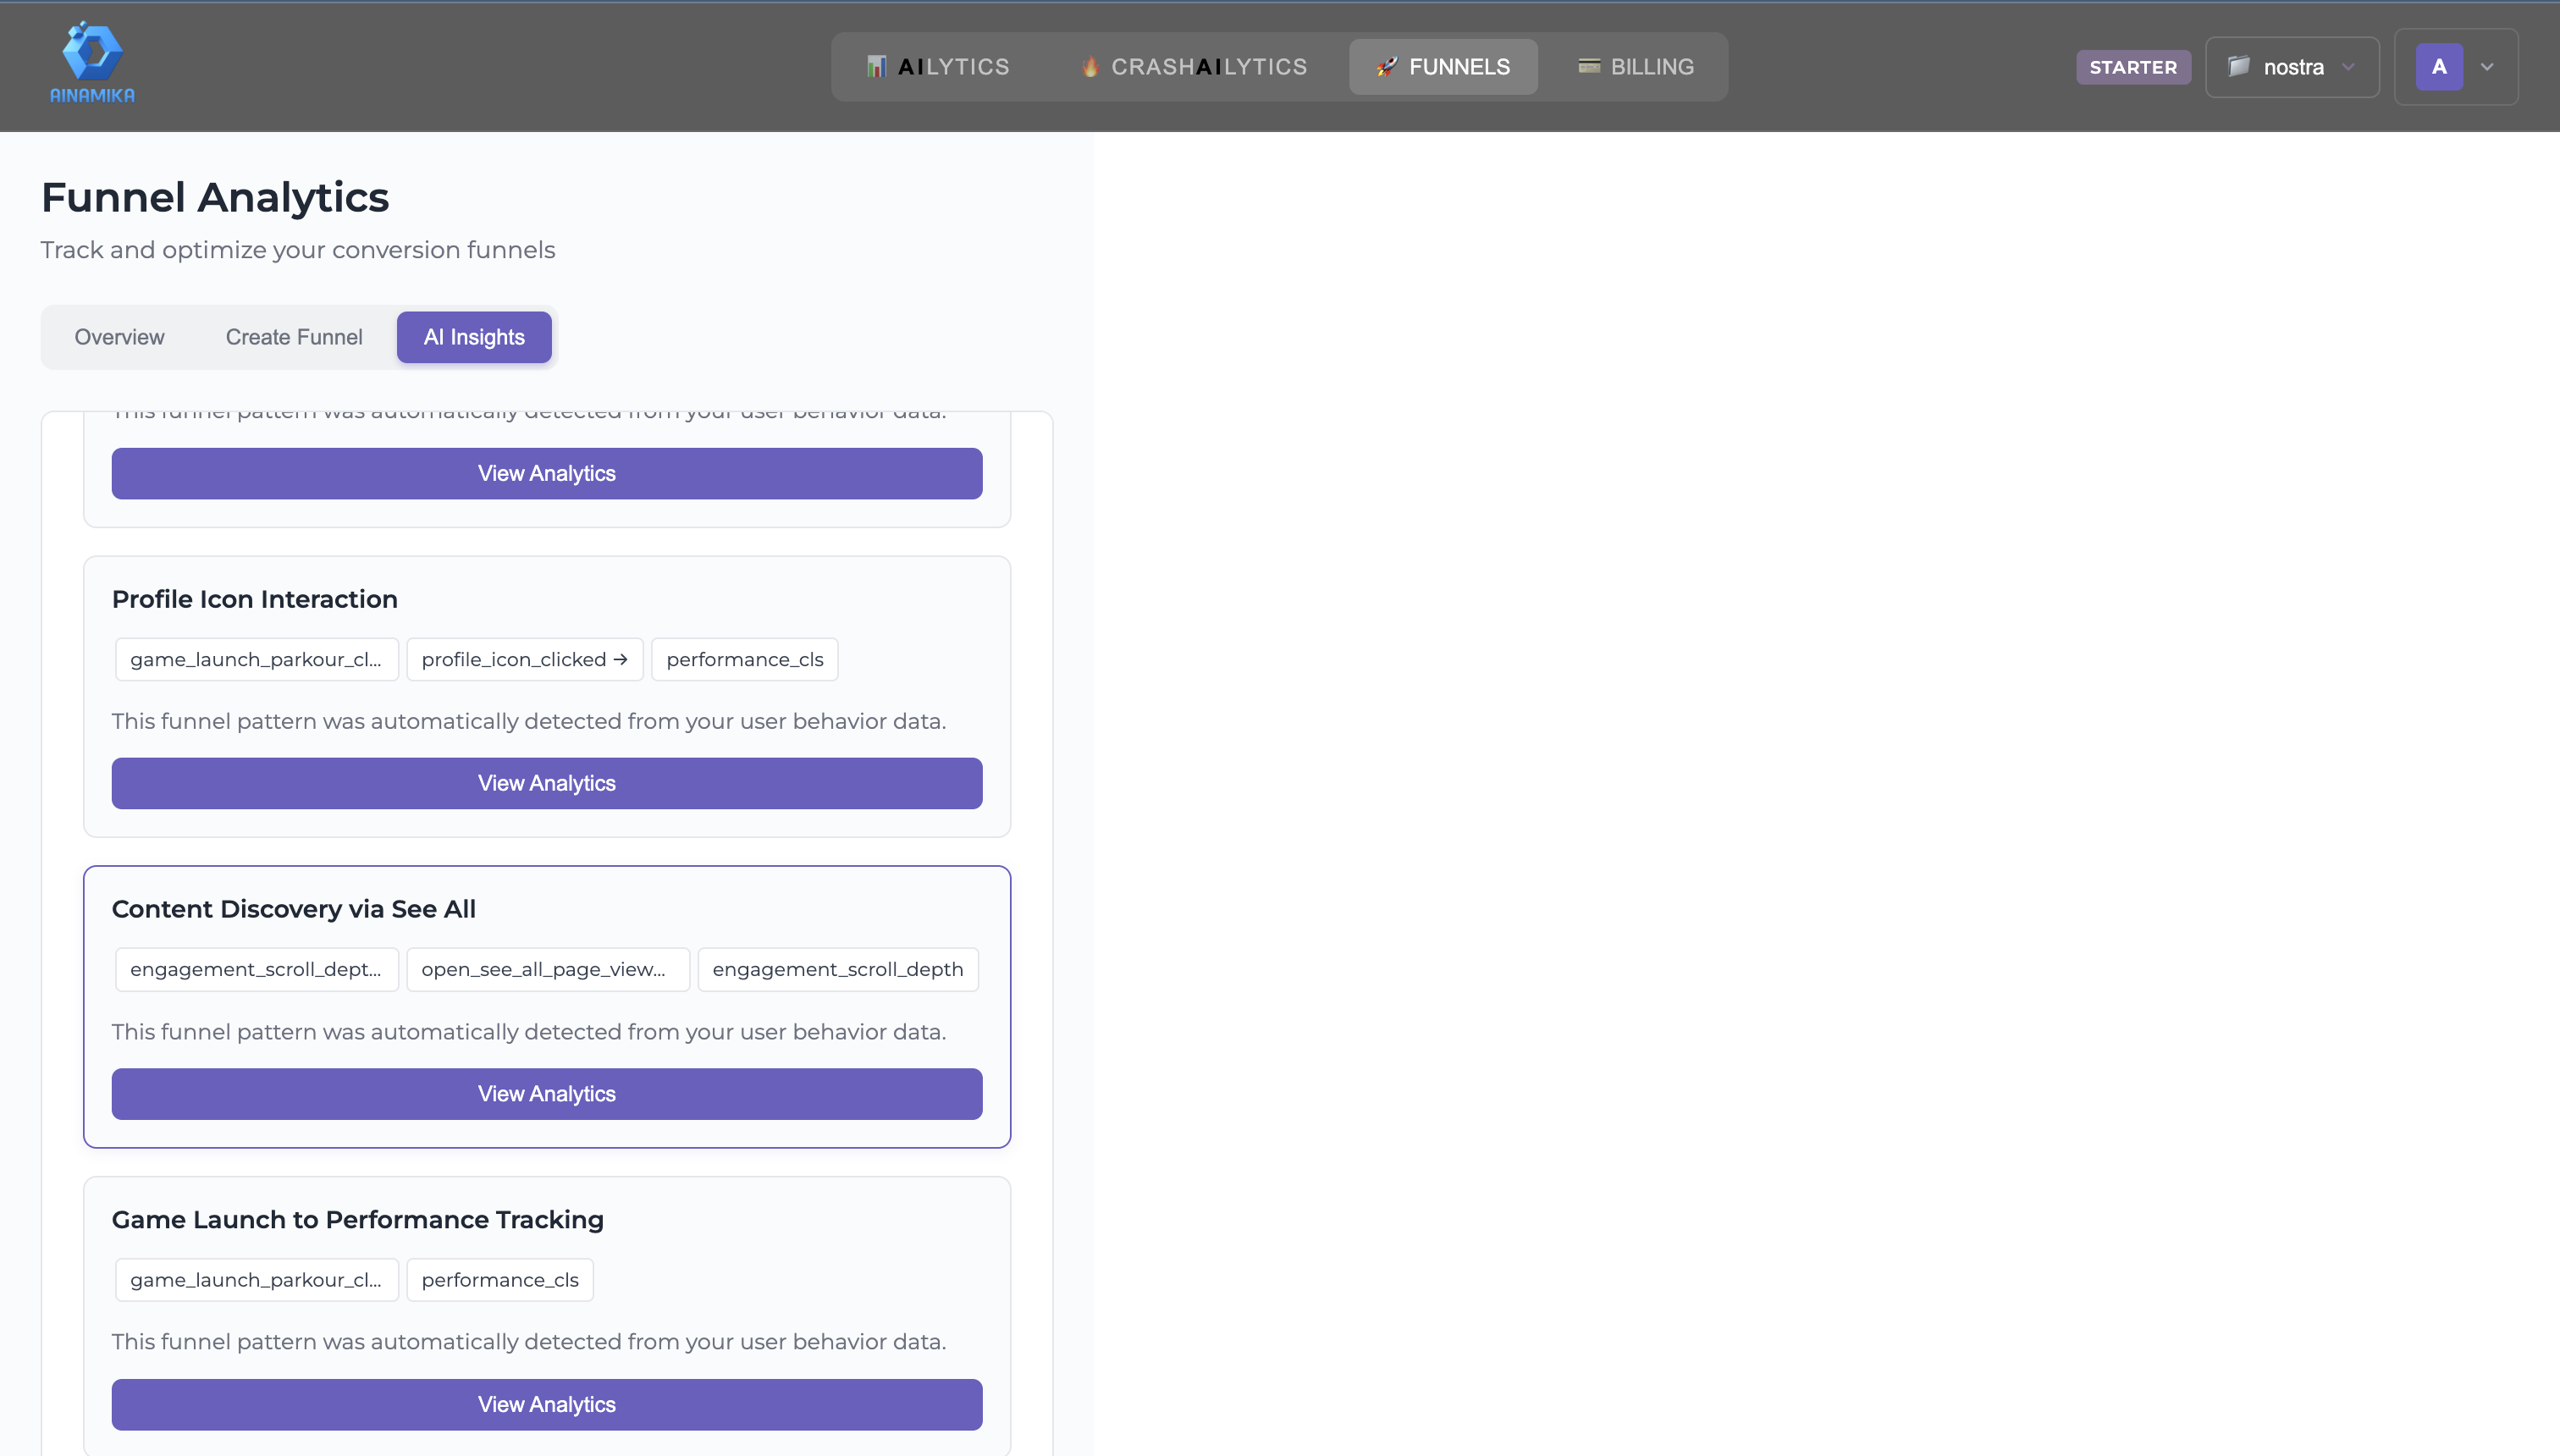
Auto-Detected Funnel Patterns
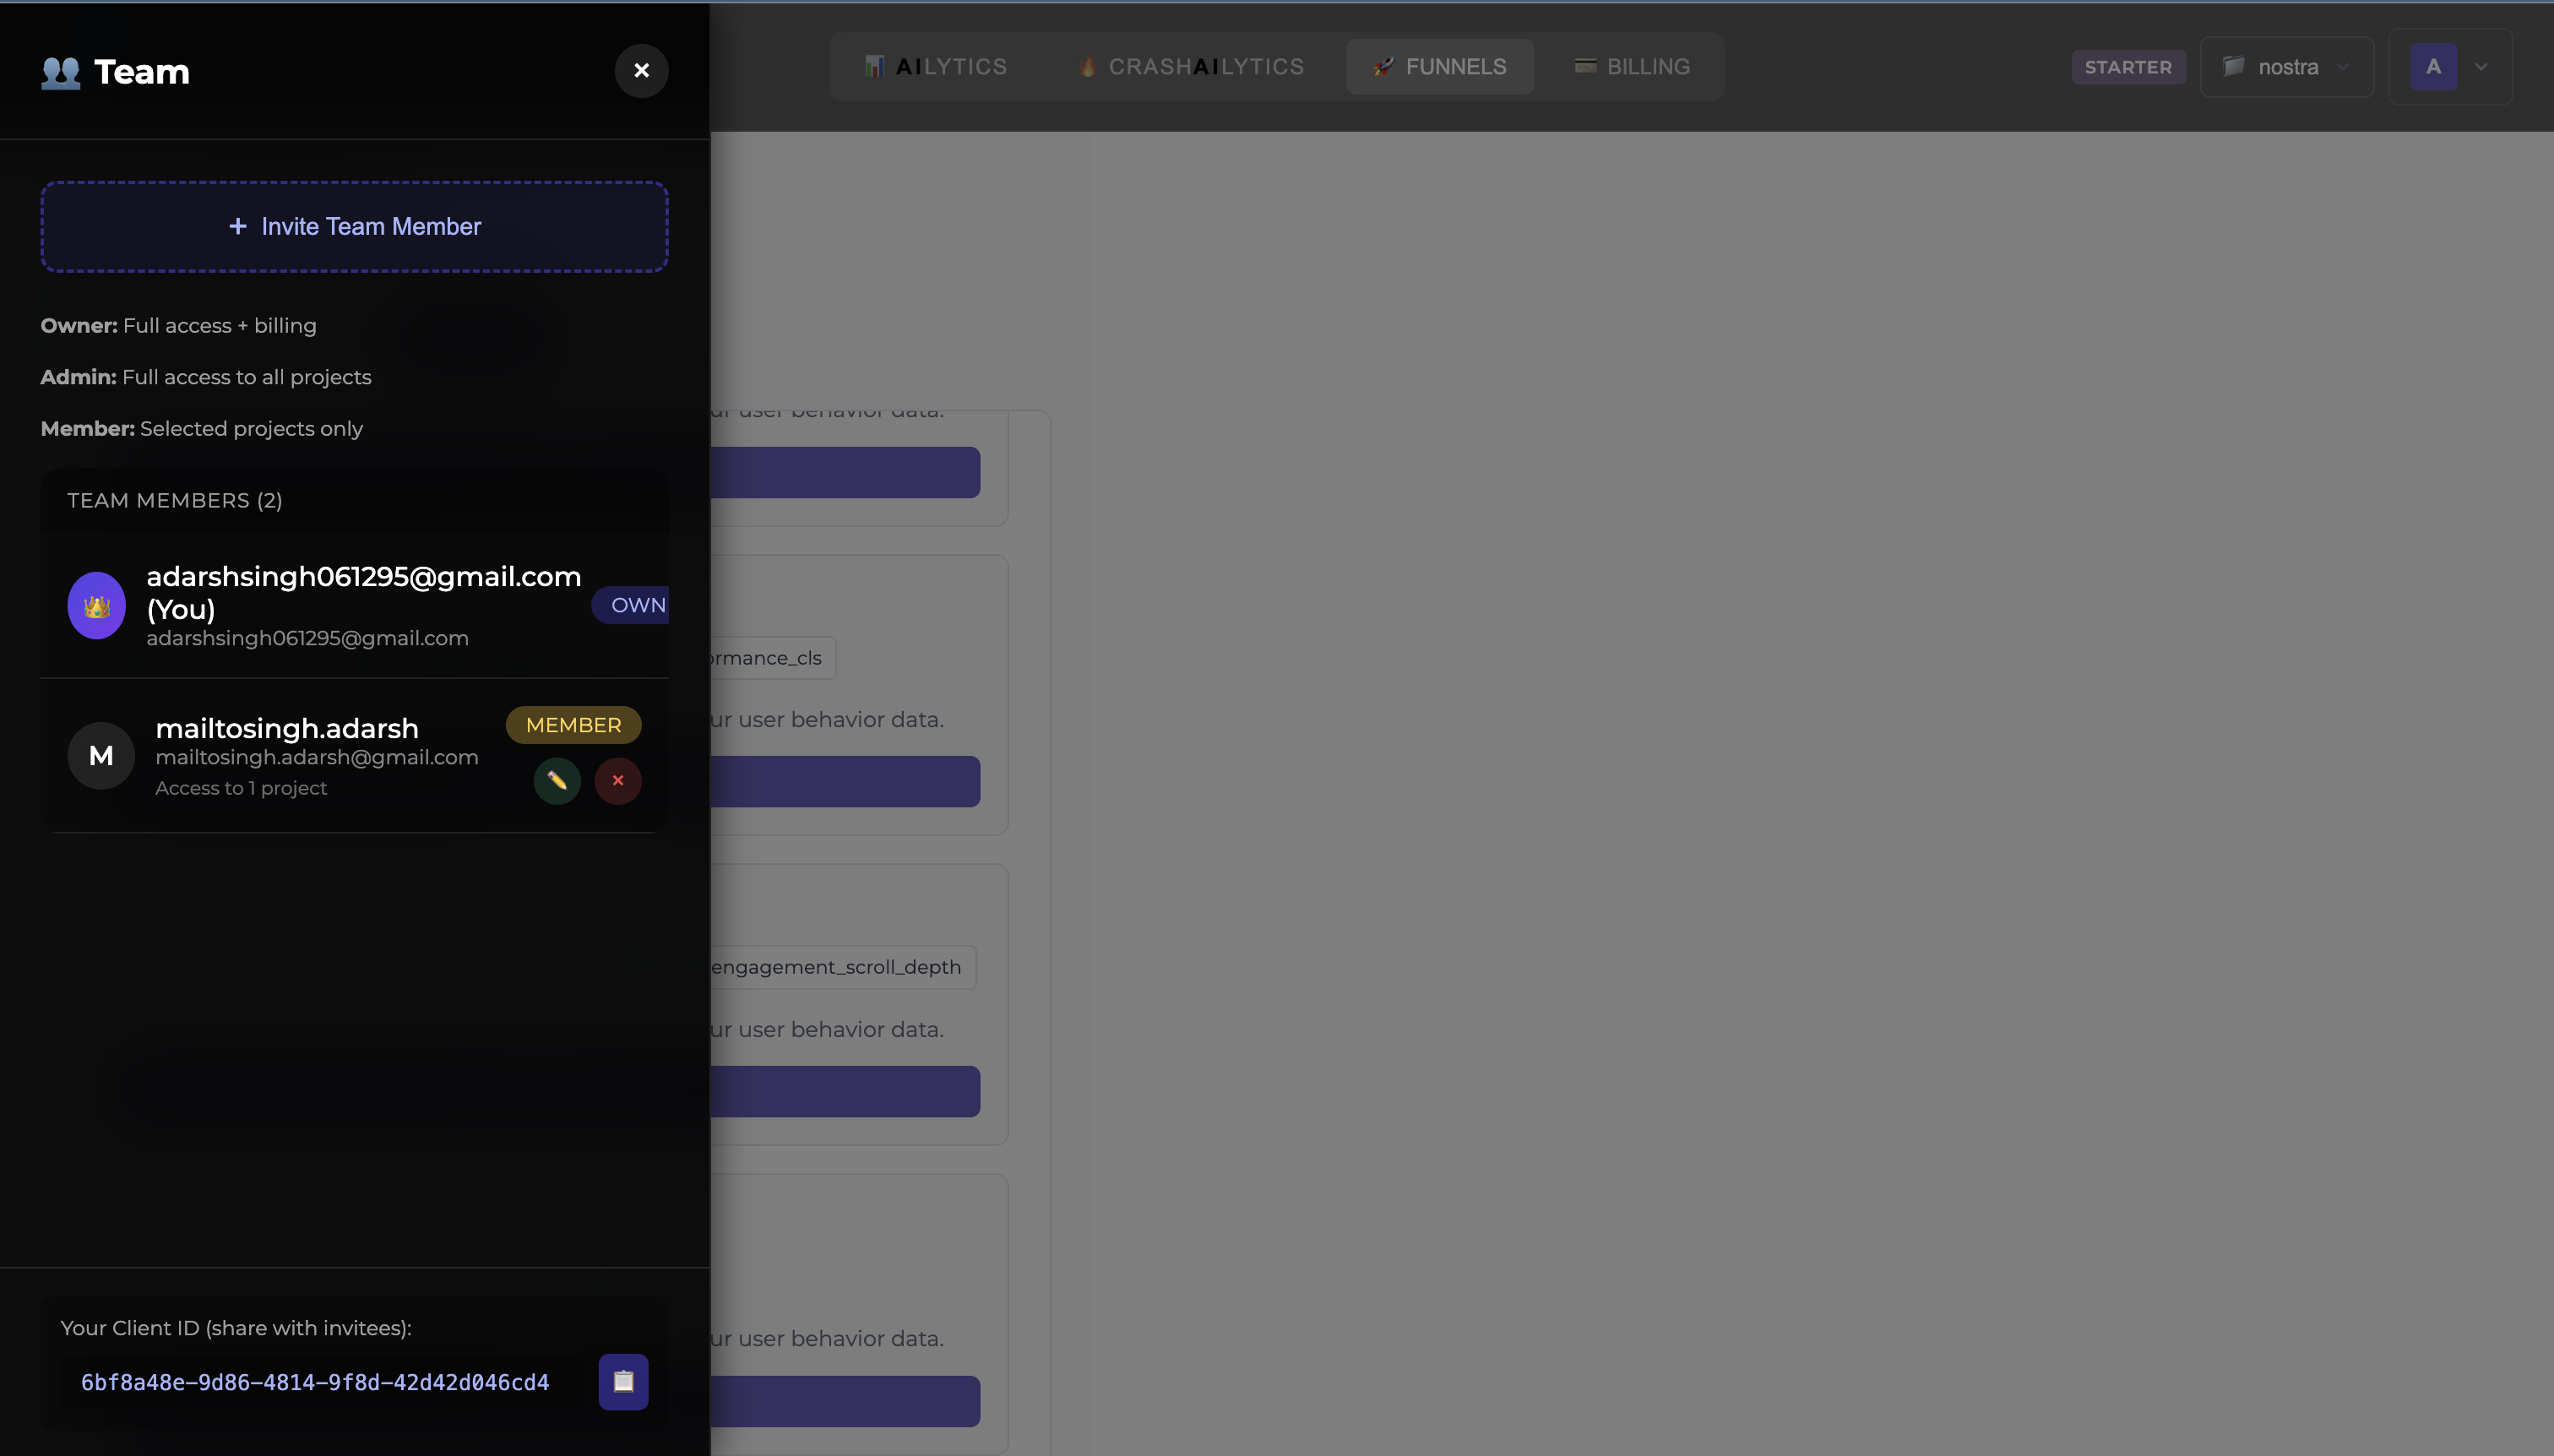
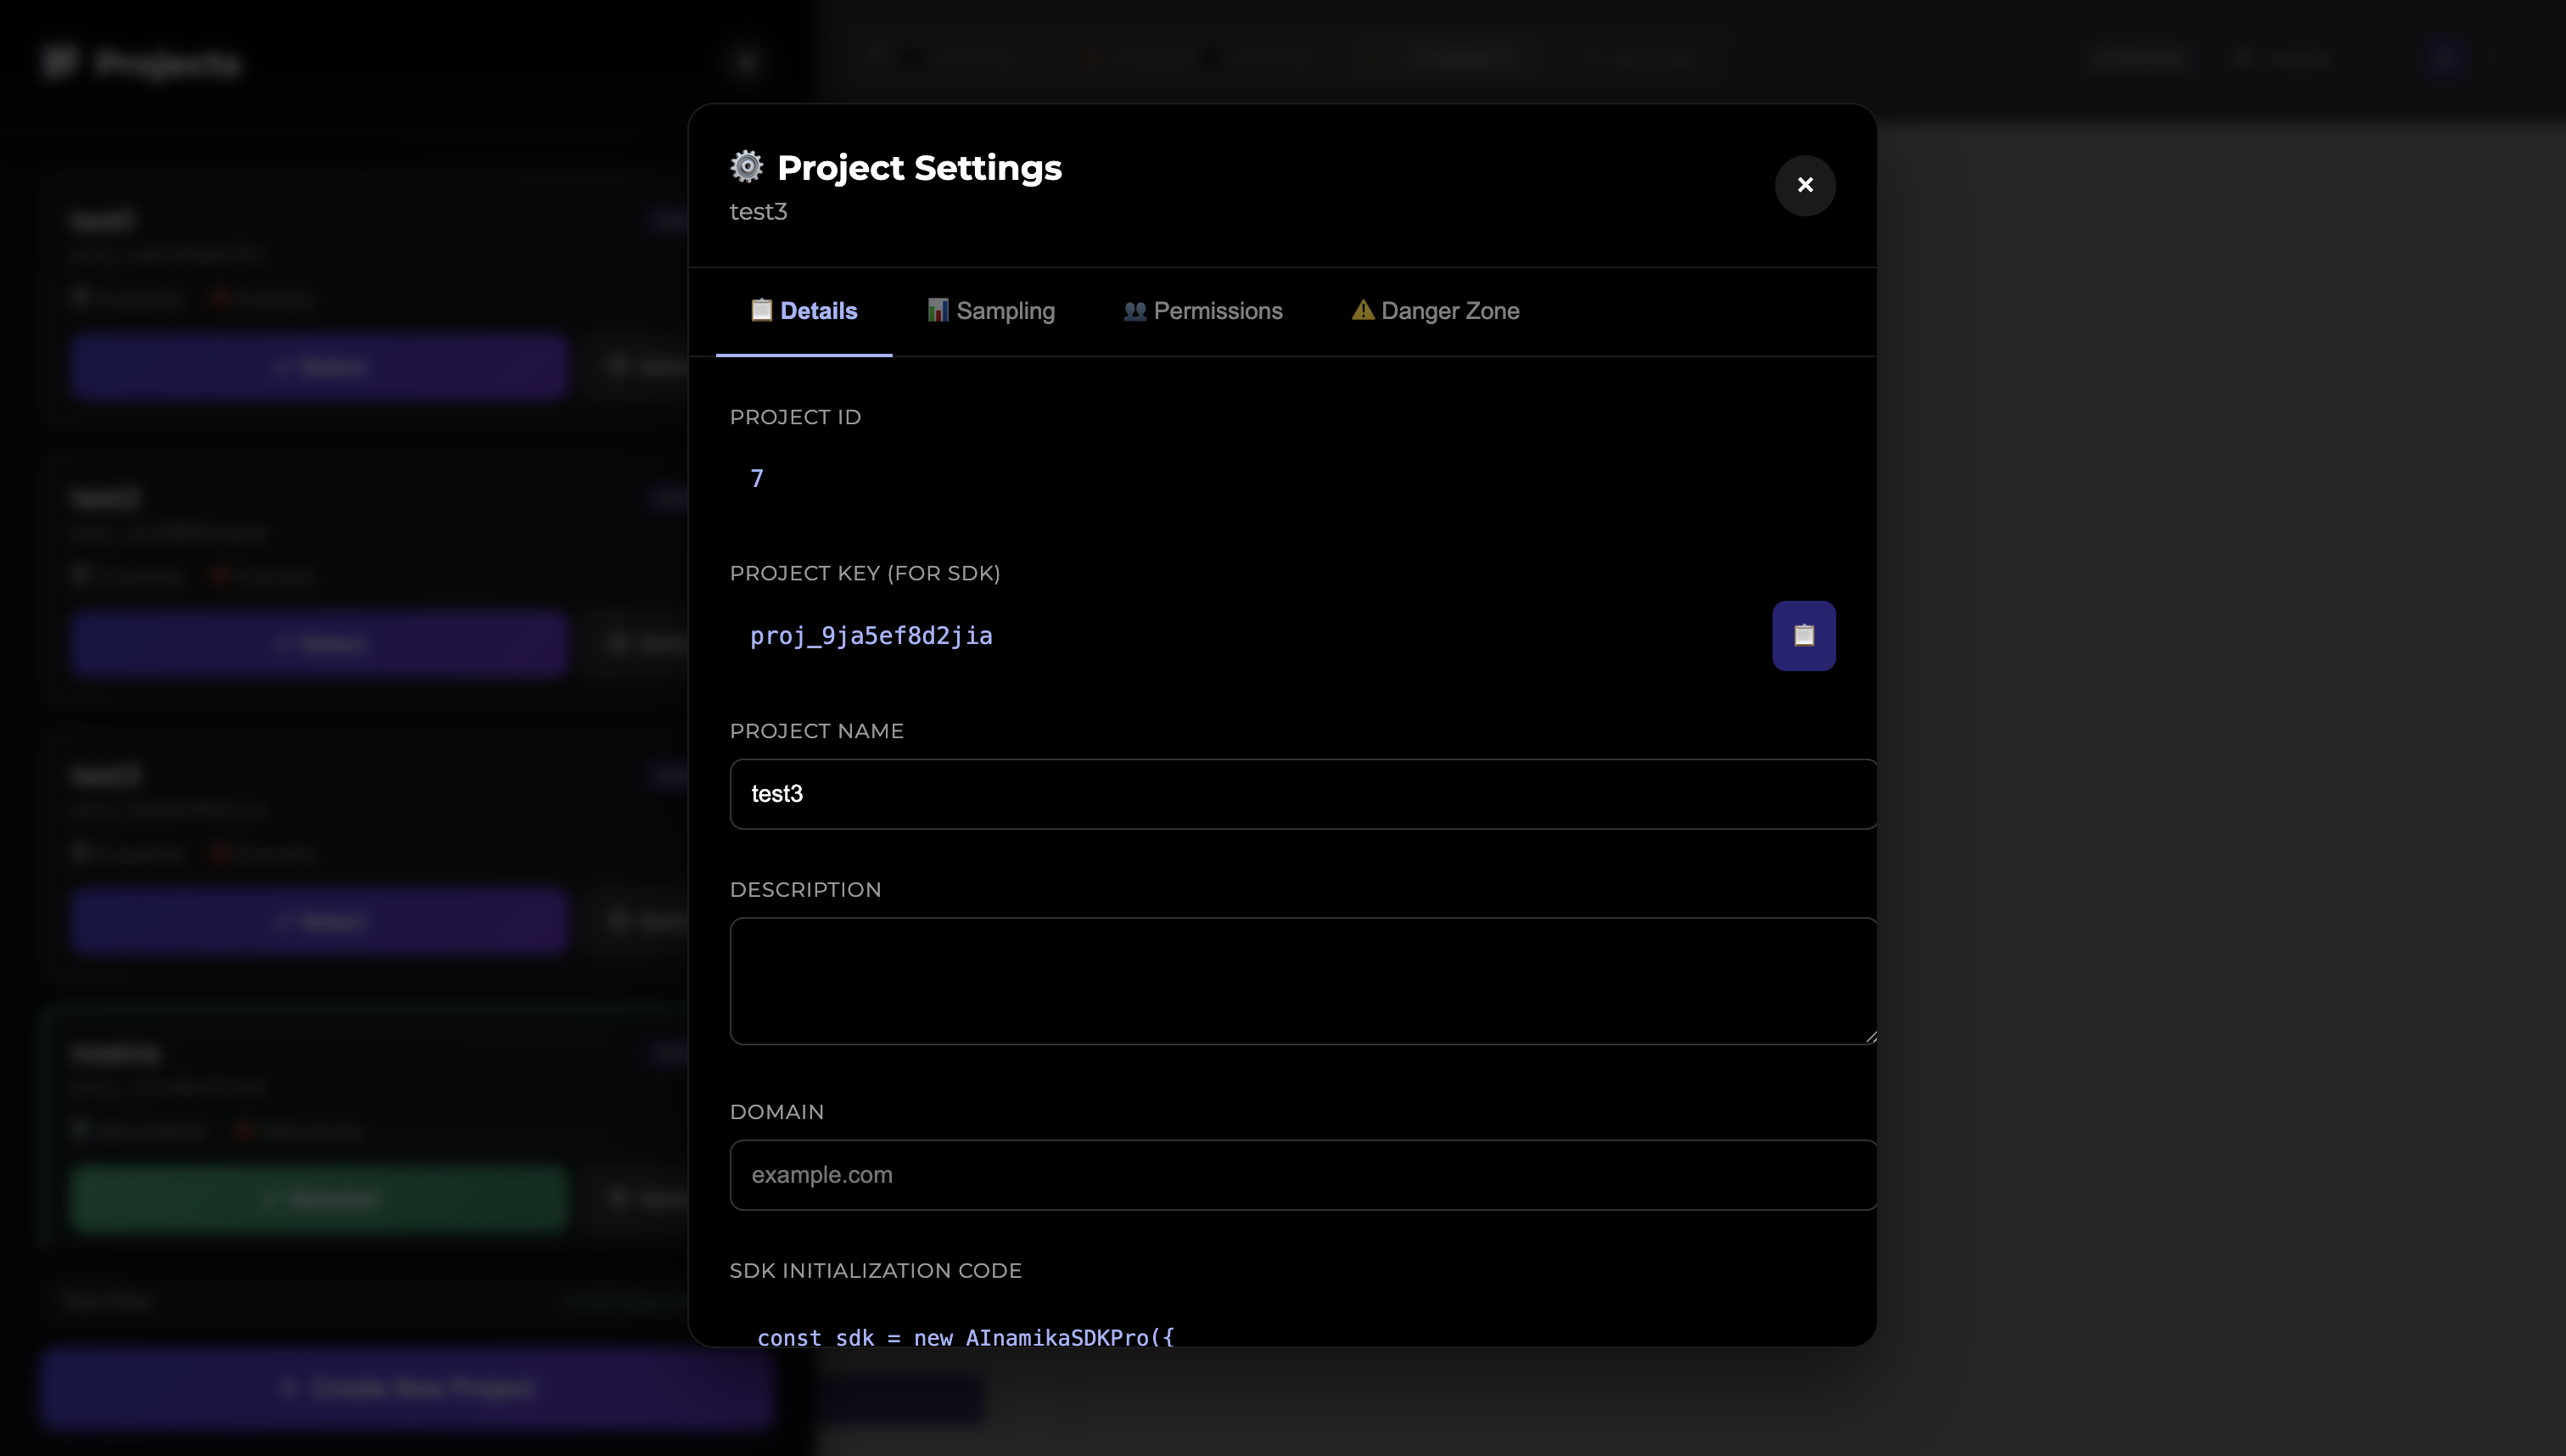
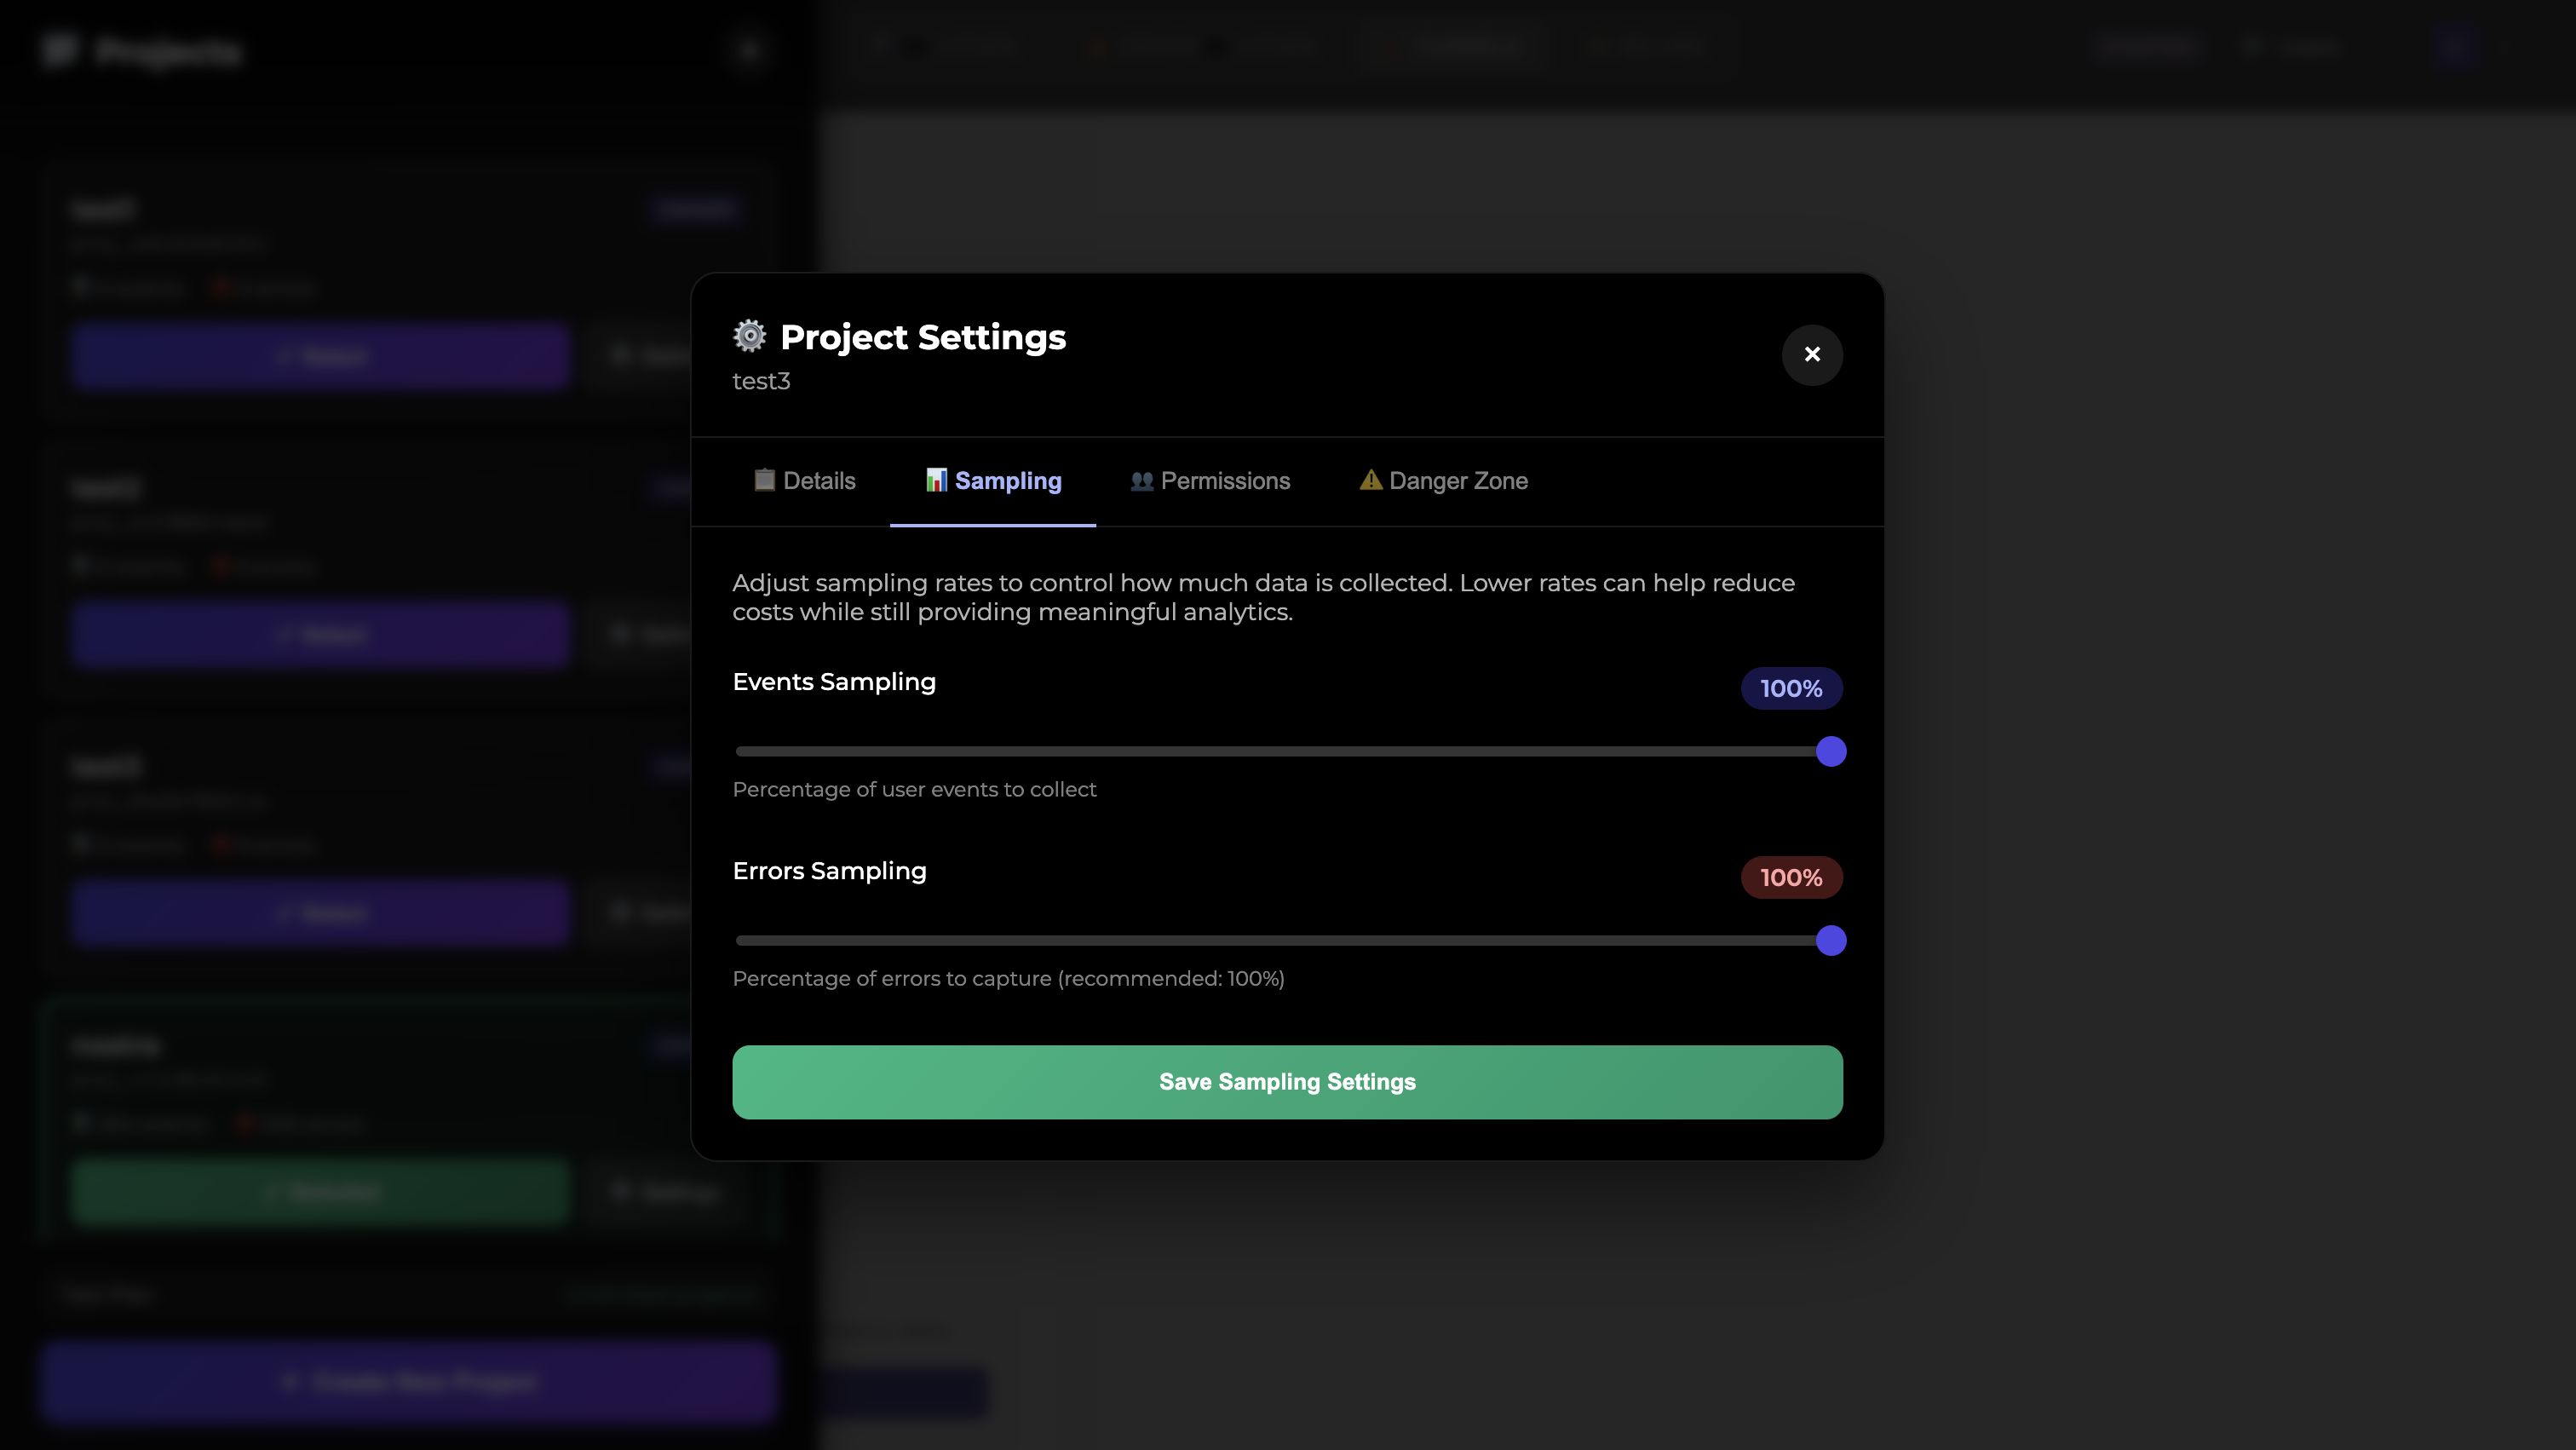
Team & Access Management